Case Study
Mexico City's ProAire programme
26th February, 2016

Do you want to close wealth and opportunity gaps in your community? Harness the power of data to advance racial equity and economic inclusion. Download our Data Tool Playbook for resources to support local governments.
Data for Equity is a Mastercard Center for Inclusive Growth program, administered by the Centre for Public Impact.
Americans should be able to succeed regardless of race, class, disability or sexual orientation. When I was first elected Mayor, I made a commitment to St. Louisans that I would put equity for people at the center of our planning and development. Since then my office has worked with the people to re-envision and reimagine a St. Louis that is free from the forces of racism and inequity that have held us back.
As a step in our journey to build a new St. Louis, we launched a Roadmap to Economic Justice. This strategy will empower, develop, and transform the City of St. Louis through a vibrant, just and growing economy in which all people can thrive. To complement these efforts, our city participated in Data for Equity. This program from the Centre for Public Impact and the Mastercard Center for Inclusive Growth creates an open learning environment where cities can explore how to better use publicly available data to help diagnose, explain, and address equity challenges in our communities.
St. Louis’ Data for Equity team included representatives from the Department of Planning and Design, the St. Louis Development Corporation, and the Mayor’s Office, including my Chief Equity and Inclusion Officer. Over ten weeks, they learned new data tools to refine, improve, and expand outcome measures for programs in St. Louis that are funded by the Economic Justice Action Plan and American Rescue Plan Act. They also explored how data tools can help improve analysis of our economic initiatives to ensure they are driving truly equitable outcomes for our residents.
We believe that the data tools and approaches our team learned from Data for Equity can help other city departments advance equity. The public servants who participated in the cohort are already sharing what they learned with their colleagues in other departments and are developing plans to ensure this knowledge intentionally spreads to other city departments, particularly those involved in urban equity and economic development.
Seven other cities joined St. Louis in the Data for Equity cohort. We shared what St. Louis is doing to incorporate a racial equity lens into governmental decision-making and expand economic opportunities. We learned about other cities’ exciting equity-led approaches to housing development and accessibility, workforce development, and neighborhood investments.
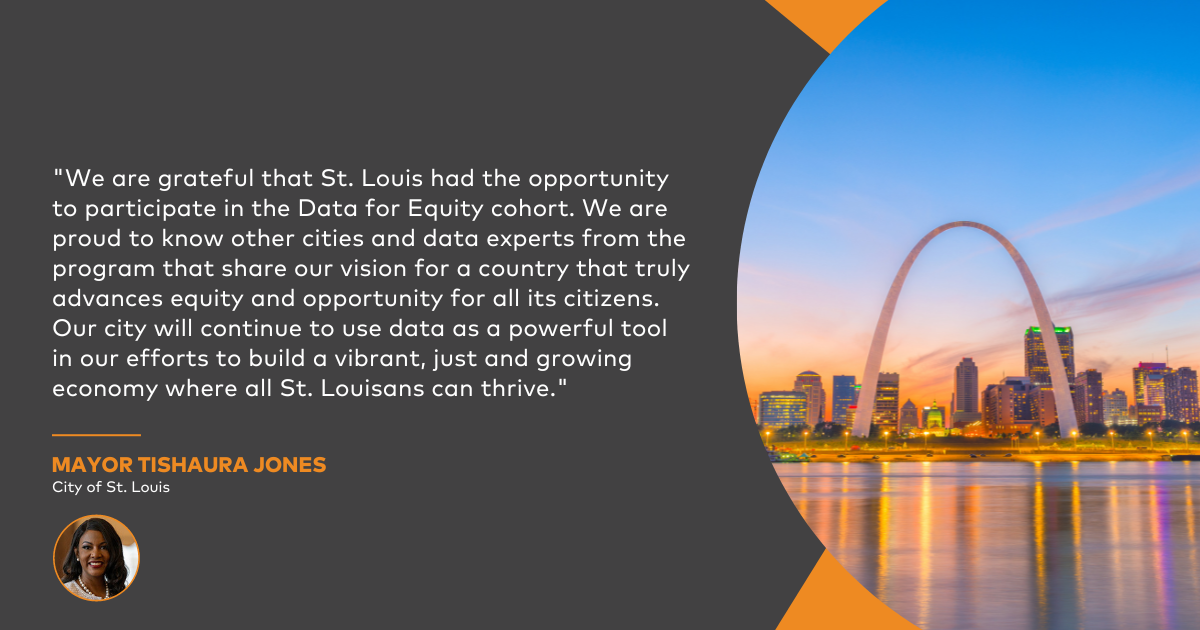
We are grateful that St. Louis had the opportunity to participate in the Data for Equity cohort. We are proud to know other cities and data experts from the program that share our vision for a country that truly advances equity and opportunity for all its citizens. Our city will continue to use data as a powerful tool in our efforts to build a vibrant, just and growing economy where all St. Louisans can thrive.
Sincerely,
Mayor Tishaura Jones
On behalf of the City of Atlanta, we are honored to have participated in the 2022 Data For Equity cohort with the Centre for Public Impact in partnership with the Mastercard Center for Inclusive Growth.
As a Georgia Tech alumnus, data has always served as the cornerstone that I leverage to establish benchmarks and make decisions. In the face of a myriad of challenges exposed and exacerbated by the pandemic, cities across the country collectively learned the importance of data and were forced to reimagine a government that works for everyone.
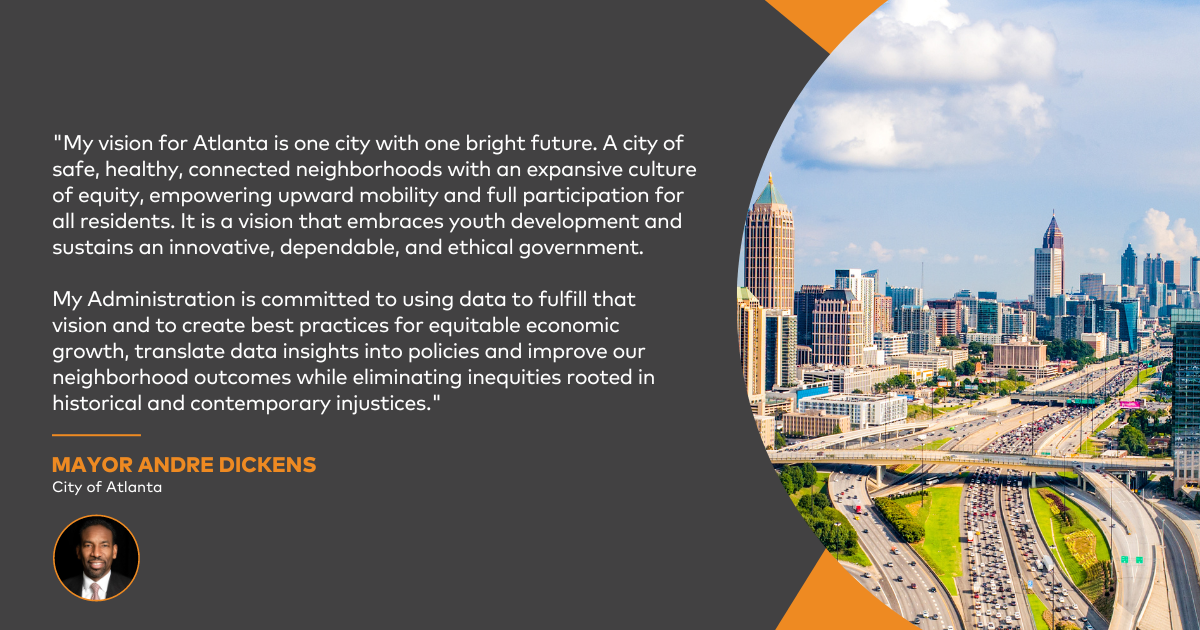
My vision for Atlanta is one city with one bright future. A city of safe, healthy, connected neighborhoods with an expansive culture of equity, empowering upward mobility and full participation for all residents. It is a vision that embraces youth development and sustains an innovative, dependable, and ethical government.
My Administration is committed to using data to fulfill that vision and to create best practices for equitable economic growth, translate data insights into policies and improve our neighborhood outcomes while eliminating inequities rooted in historical and contemporary injustices.
Atlanta is a vibrant city, rich in history and culture. In 2022, Money Magazine selected the city of Atlanta as the best place to live in the United States. This recognition highlights our legacy of equitable economic policies, diverse quality of life amenities, a booming technology sector, and engaged government all birthed and cultivated from our roots as the birthplace of the Civil Rights Movement.
In the spirit of Atlanta’s legacy, we are always searching for ways to improve the quality of life for the people we serve. Through this partnership we are able to put the needs of Atlantans first and ensure our investments support key initiatives, eliminate barriers, connect citizens to resources and grow neighborhoods to move Atlanta forward, together.
Sincerely,
Mayor Andre Dickens
Over the last 75 years, a growing global and national economy has contributed to rising living standards, significant advances in technology, and soaring innovation in the United States and around the world.
Despite these improvements, vast segments of the population have not shared in the ownership and the benefits of this economic growth. Mounting imbalances have resulted in an inequitable distribution of opportunity, income, and wealth disproportionately impacting historically marginalized and excluded communities. The Covid-19 pandemic and resulting economic downturn further exposed these inequities.
Cities across the United States are working to solve a host of challenges facing their communities. As more than $330 billion in federal funding is being made available to local governments, planners and policymakers can use data-driven insights and tools to ensure new investments benefit all communities. However, local officials need the capacity to put tools, resources, and expertise together to achieve equitable outcomes.
In late 2022, the Mastercard Impact Fund, with support from the Mastercard Center for Inclusive Growth (CFIG) developed the Data for Equity program, partnering with the Centre for Public Impact (CPI) to create an open learning environment that supported city leaders in leveraging data assets for outcomes that matter to their residents, with a particular focus on racial equity and closing wealth and opportunity gaps. Working together across municipal agencies, leaders learned about tools and frameworks to support their work tackling the urgent task of building more equitable and inclusive cities.
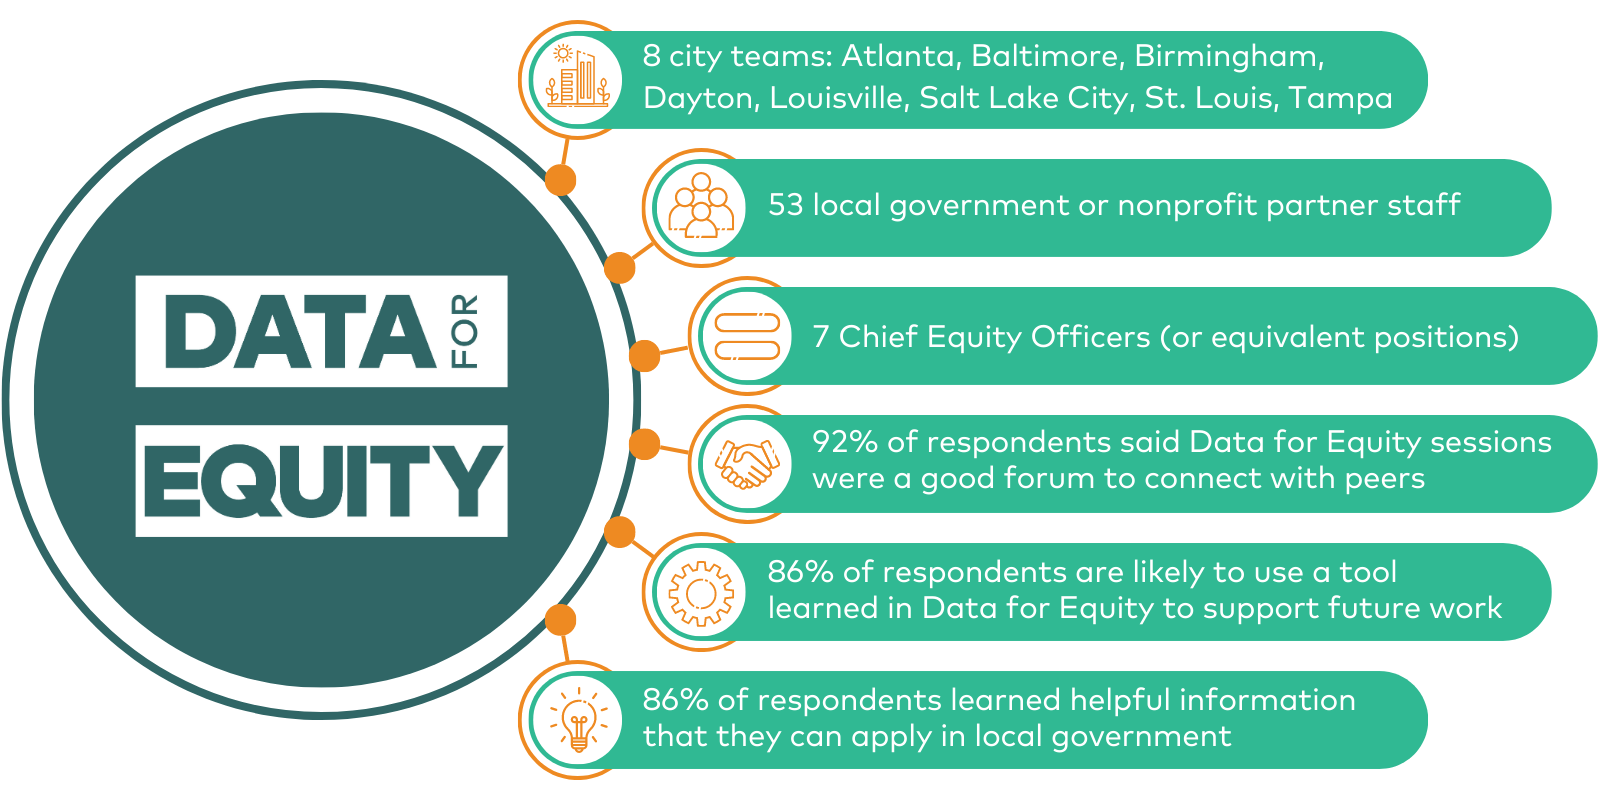
Data for Equity brought together a cohort of Chief Equity, Technology, and Data Officers from eight U.S. cities — Atlanta, Baltimore, Birmingham, Dayton, Louisville, Salt Lake City, St. Louis, and Tampa — alongside other equity and inclusion, civil rights, economic development, and innovation leaders. In a collaborative environment, participants gained access to innovative, place-based data tools; connected with data experts from organizations including the Brookings Institution, the Urban Institute, the Southern Economic Advancement Project, and Accelerator for America; and joined a network of leaders who are committed to using the power of data to advance racial equity and economic inclusion.
This report describes the Data for Equity cohort learning journey, case studies of how participating cities engaged with and learned from the program, and key takeaways about the potential for data to inform effective and innovative equitable development efforts. Alongside data tools, participants explored the value of qualitative data, the critical link between racial equity and economic inclusion, and how federal funds can advance ongoing equity initiatives.
Cohort members gained and shared insights throughout their learning journey, including:
Resources that provided guidance on how to target funding were helpful to ensuring the viability of cities’ equity and economic development initiatives.
Tools and resources that helped practitioners move from diagnosing challenges to identifying solutions were especially valuable.
Peer-to-peer learning is an essential resource for leaders and staff working in equity roles, which are often structured differently than other city offices.
More data tools that explicitly measure racial equity indicators are needed.
Each city team concluded its Data for Equity journey by outlining plans to put what they learned into action. Plans included creating city-specific data tool repositories, convening new interagency equity teams, integrating new data tools into existing programs, and more.
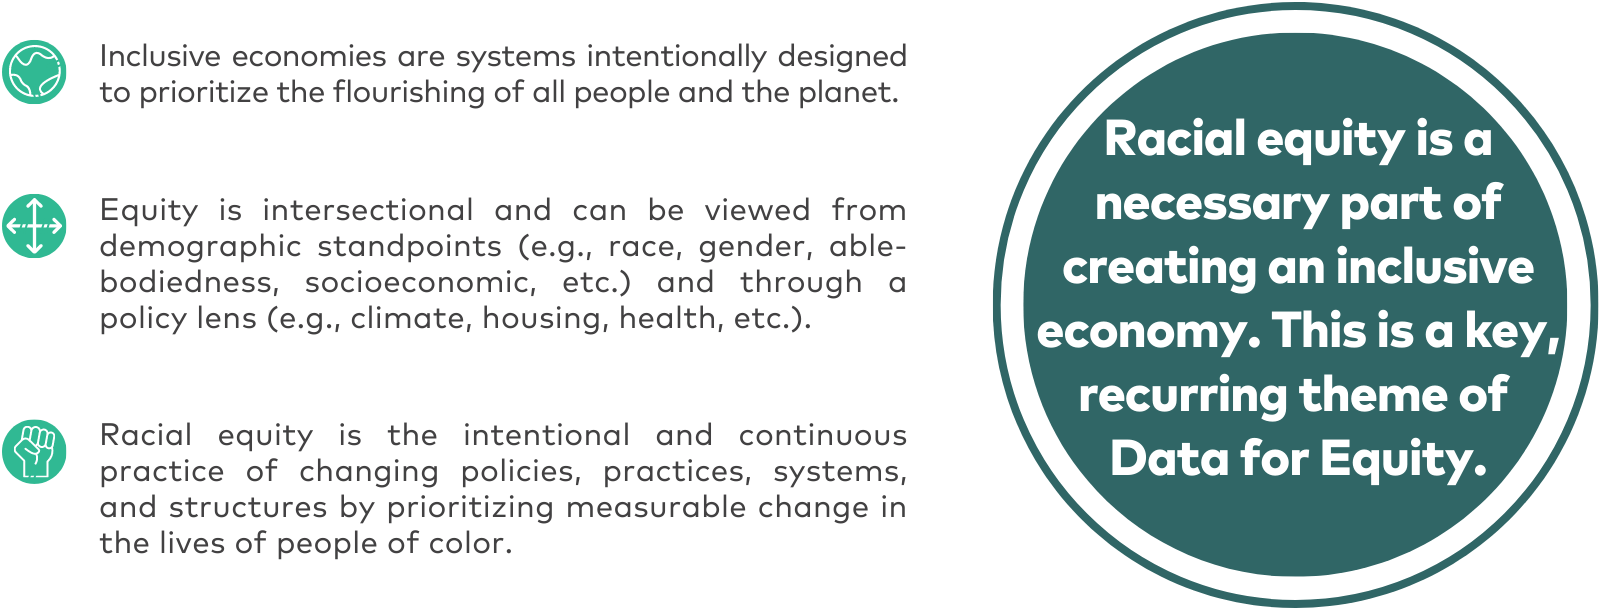
City leaders are in a position to create policy and funding interventions that create new opportunities and shape more equitable and inclusive economies. Data tools are a critical resource for this work. Data for Equity equipped city government equity leaders with these resources and began to build a network that will strengthen this emerging practice.
The dual crises of the COVID pandemic and racial reckoning have magnified the urgency to address historic inequities in our cities. In the last decade, local governments have established departments and commissions dedicated to advancing racial equity in their unique contexts, including over 130 cities with more than 100,000 residents.
Historic levels of federal funding in economic growth from legislation, including $350 billion from the American Rescue Plan Act (ARPA) State and Local Recovery Fund and $1.5 billion in state and local infrastructure investments from the Infrastructure Investment and Jobs Act (IIJA), have created an opportunity to help local, state, tribal, and territorial governments understand how best to direct resources to build more truly inclusive economies. This level of funding presented an opportunity for cities to more proactively incorporate equity analysis into their funding strategies.
CFIG is constantly looking for opportunities to leverage the power of data for social impact. From benchmarking to evaluating impact, from informing decisions to measuring progress, from improving organizational capacity to driving insights, data can make what was once invisible, visible. Since 2019, CFIG has been a leader in building the field of data for social impact. The Center builds data capacity through partnerships like a $5 million grant to Howard University to support the creation of the Center for Applied Data Science and Analytics and supporting the launch of data.org’s Capacity Accelerator Network (CAN) in the U.S., which contributes to training 1 million purpose-driven data practitioners from underrepresented communities.
Mastercard’s In Solidarity initiative invests in Black communities by expanding city programs to support black communities, develop and share affordable financial tools and services, and provide capital and resources for Black-owned businesses. Through this initiative, Mastercard learned more about the challenges and opportunities city governments' equity initiatives faced, and how they could support them.
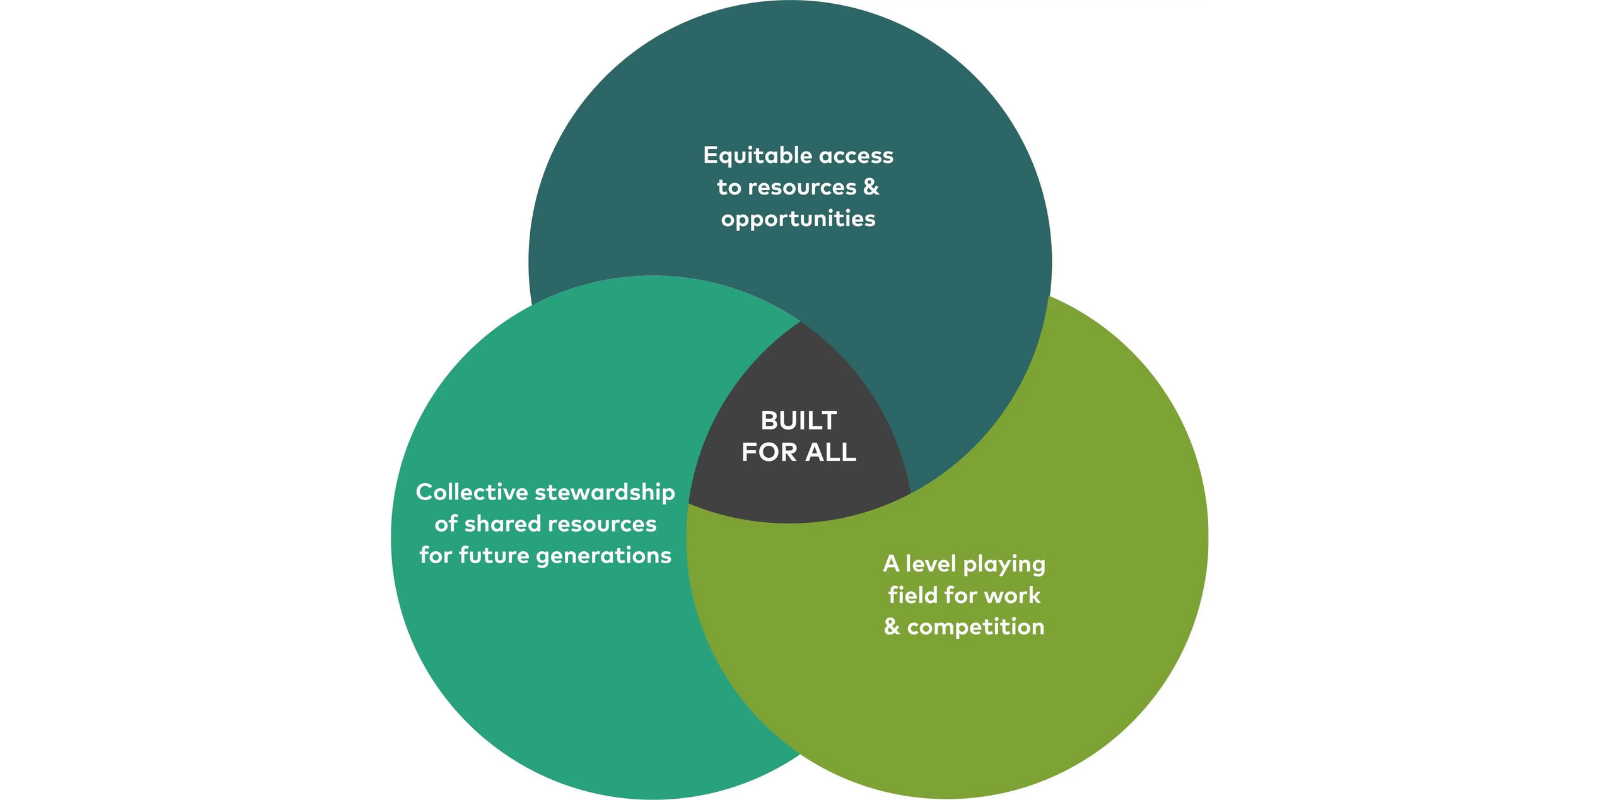
CFIG and the Centre for Public Impact first worked together in 2020 to develop Built for All, a global framework for building inclusive economies that puts forth a set of ideal outcomes of an inclusive economy and potential actions that the private, public, and civic sectors can take to reimagine and rebuild economies. In response to feedback from In Solidarity cities, CFIG brought CPI on board again to administer a program dedicated to building equity offices’ capacity to identify and create data-driven solutions.
For the inaugural Data for Equity cohort, CPI and CFIG brought together equity and innovation leaders from eight US cities to identify data tools and frameworks that align with their equity needs and goals, share insights with each other, and begin to apply learnings to building inclusive economies. Data for Equity created a collaborative learning space for participants to ideate on solutions for their specific contexts and share insights with their peers.
Rigorous data can make the invisible or obscured more visible. It can reveal new information and identify trends that illuminate how people in the same city can have vastly different life experiences. When paired with qualitative data from residents, quantitative data can show how individual and community experiences may be part of a larger pattern.
Innovations in data collection, interpretation, and analysis offer new opportunities for governments, communities, and their private and nonprofit sector partners to understand equity challenges and make evidence-based policy decisions. Data analysis and visualization tools can help cities make more informed choices in where to target resources to address the long-term impact of historically discriminatory policies and practices. Tracking economic and well-being outcomes over time can help measure the impact of new interventions, and show whether they are serving communities equitably.
Practitioners in the emerging field of municipal equity work understand the benefits of using data effectively. While Chief Equity Officers and other practitioners broadly share a commitment to use data to advance equity, and many tools and resources are available to support them, they often need capacity support to put the pieces together to achieve the outcomes that matter.
Data for Equity aimed to provide a space for cities to receive guidance and lay the foundations for a Community of Practice for equity officials to learn about these resources in a co-learning environment.
The Data for Equity learning cohort brought together 53 leaders and staff in equity, innovation, and data departments from eight cities (Atlanta, Baltimore, Birmingham, Dayton, Louisville, Salt Lake City, St. Louis, Tampa), including five Chief Equity Officers and 24 senior officials. Roles included city managers, directors of innovation, economic development administrators, and community engagement coordinators. Some city teams also included representatives from their nonprofit partners. CPI focused on these roles to reach the people best positioned to use data tools for equity work and growing an inclusive economy.
As participants in the program, participants had opportunities to:
Discuss equitable economic growth and apply learnings in real time to their cities’ equity and economic development work
Interact with government innovation experts
Learn about digital tools that leverage city-specific data
Build a network with other cities
Earn a certificate of completion from the Centre for Public Impact
Receive media spotlight opportunities
The structure of the program included a series of virtual cohort workshops that catalyzed collaboration among leaders from disparate regions and cities with independent city team meetings between workshops.
Workshops included a showcase of place-based digital tools, coaching from the Centre for Public Impact, and access to research and policy experts. Participants also discussed the methodology to identify useful data, prioritize budgets, and leverage federal funding opportunities. During office hours after each cohort workshop, participants had the opportunity to engage further with tool developers and each other.
All tools covered in the program were free to access and nationally available. Tools that were presented in cohort sessions, as well as additional tools that expanded on session topics, were shared in a repository that enabled participants to maintain access after the program ended.
Each city customized its engagement with the program. While some teams had nine people, Tampa, Florida had one city leader in the program, who acted in an observational capacity. Regardless of the size of their team, each participant added value by representing their city’s perspective to the rest of the cohort and in city-specific meetings.
Final deliverables included a learning memo and presentation designed to be shared with participants’ colleagues and other stakeholders. Both deliverables outlined the team’s context, project statement, the themes and data tools they found most useful, learnings from program content and from cohort cities, and next steps.
CPI selected cohort cities based on their existing racial equity and economic development work, staff capacity, mayoral engagement with equity work, and community partnerships. It was also important to include cities from different regions with a mix of population sizes.
Case studies for cohort cities later in this report detail each location’s unique context, each team’s goals for the program, and how they plan to use their new understanding of data tools, funding considerations, and practical frameworks going forward.
Data for Equity participants often remarked that while their cities were unique, they also shared many things in common in terms of historical and structural racism, economic trends, and how they continue to impact Black residents and other communities of color today. The impact of housing discrimination and of major shifts in local economies, outlined broadly here, were particularly relevant to many cities’ engagement with Data for Equity and are echoed throughout the case studies that follow.
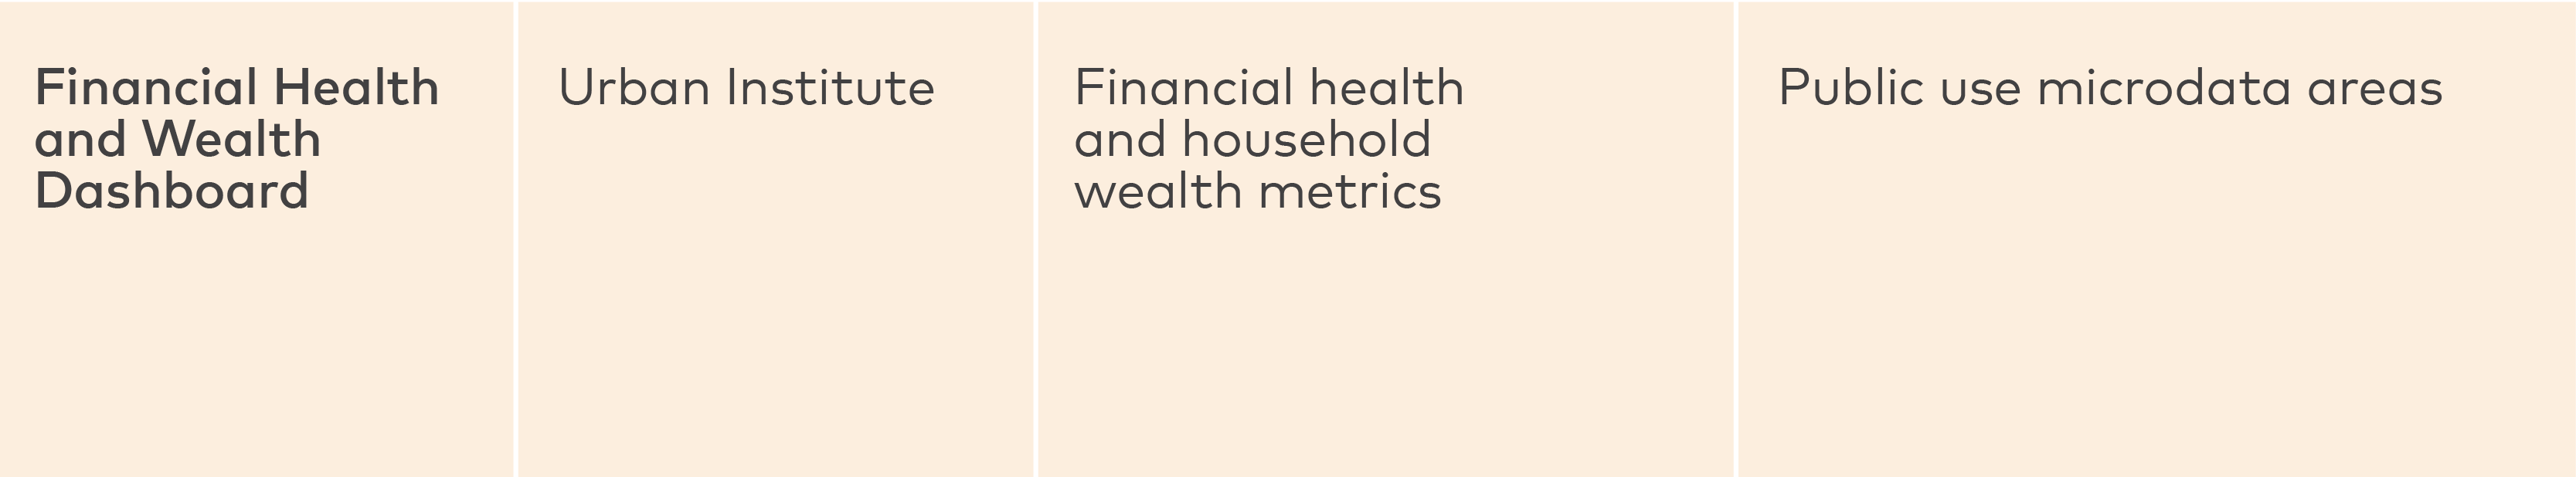
Some of the data tools and frameworks shared with the Data for Equity cohort also factored in elements of this history, through an understanding of how historical practices and disinvestment influence current social determinants of health, family and community wealth, and access to business development opportunities. For example, the developers of the Urban Institute's Financial Health and Wealth Dashboard, a tool featured in the cohort curriculum, shared that the current racial wealth gap is the result of policies and practices that deliberately excluded people of color, particularly Black people, from economic opportunities.
Legacy of housing discrimination
While Southern cities like Atlanta, Birmingham, and Louisville had stringent segregation laws under Jim Crow well into the Twentieth Century, every city in the Data for Equity cohort was affected by racist policies like redlining and restrictive housing covenants that prevented Black and Brown residents from living in certain areas and accessing opportunities to build wealth.
.png)
Regardless of these circumstances, Black residents created thriving communities. For example, the Little Africa neighborhood was a tight-knit community for Black Louisville residents. Unfortunately, many of these communities were disrupted or destroyed when freeways and urban renewal projects in the 1940s and 1950s forced many residents to relocate into areas that were less likely to receive infrastructure and service investments than the new, growing suburbs.
These decades of discrimination and disruption continue to influence disparities in economic opportunities and overall well-being outcomes. Data for Equity cohort cities recognized the role that past governments have played in creating these inequities and explored ways to remediate them.
Economic changes
Many cities in the Data for Equity cohort were major manufacturing centers until the 1970s and 1980s, and several still have sizable manufacturing sectors. While the details differed from city to city, the Twentieth Century manufacturing boom drove a migration of Black and poor white Americans away from the rural South (and other parts of the country).
The local economies in each of these cities changed again when the domestic manufacturing industry began relocating outside of the US. Many of the predominantly white affluent residents relocated to the suburbs, and existing racial inequities persisted even as discrimination was made illegal.
In recent decades, each city has taken up the effort to attract new industries and diversify the local economy. Many jobs that have a lower barrier to entry are now found in the retail and hospitality sectors, which Data for Equity participants noted often do not pay as well. Local governments are seeking new ways to improve economic opportunities for residents that have historically had more barriers to economic prosperity.
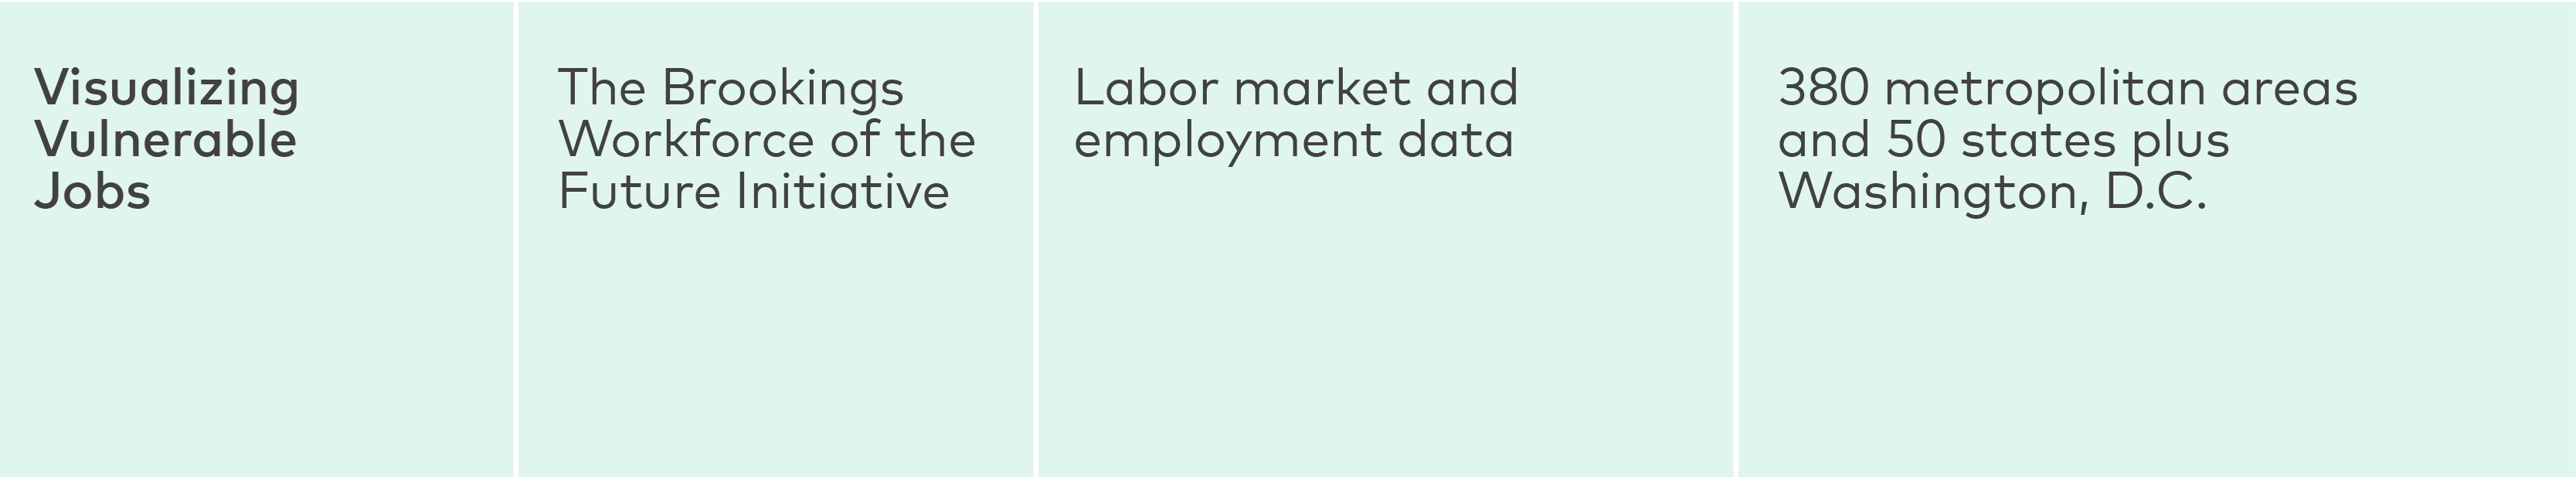
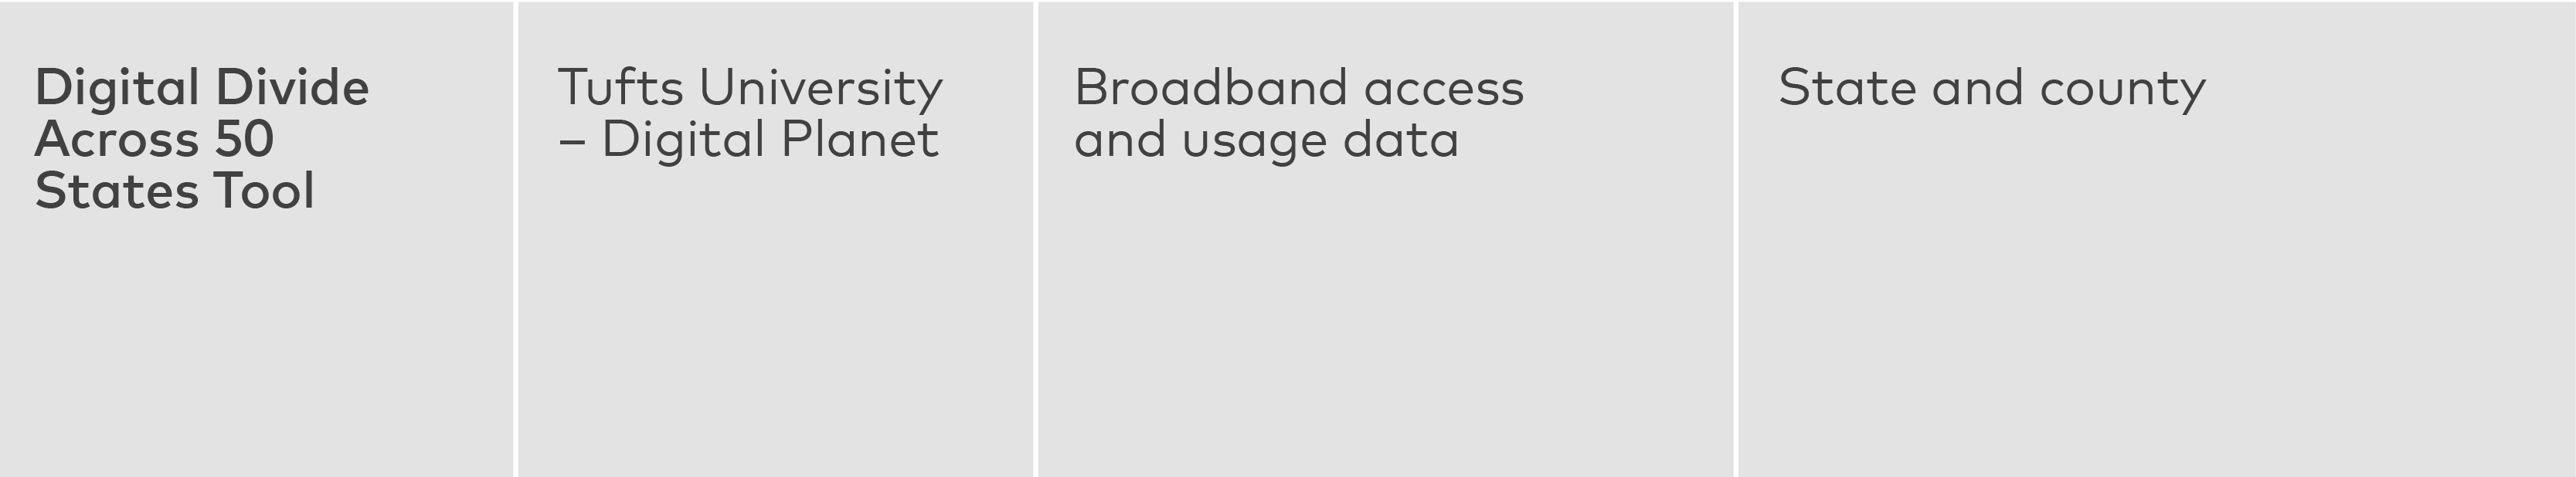
Data for Equity provided a showcase and analysis of data tools that offer different types of data across varying fields to get a holistic and widespread view of cities and their needs. Subject matter experts, including data tool developers and researchers, presented on topics including workforce and jobs, federal funding, economic mobility, and broadband access.
Specifically, the cohort learning journey included the following presenters, tools, and topics:
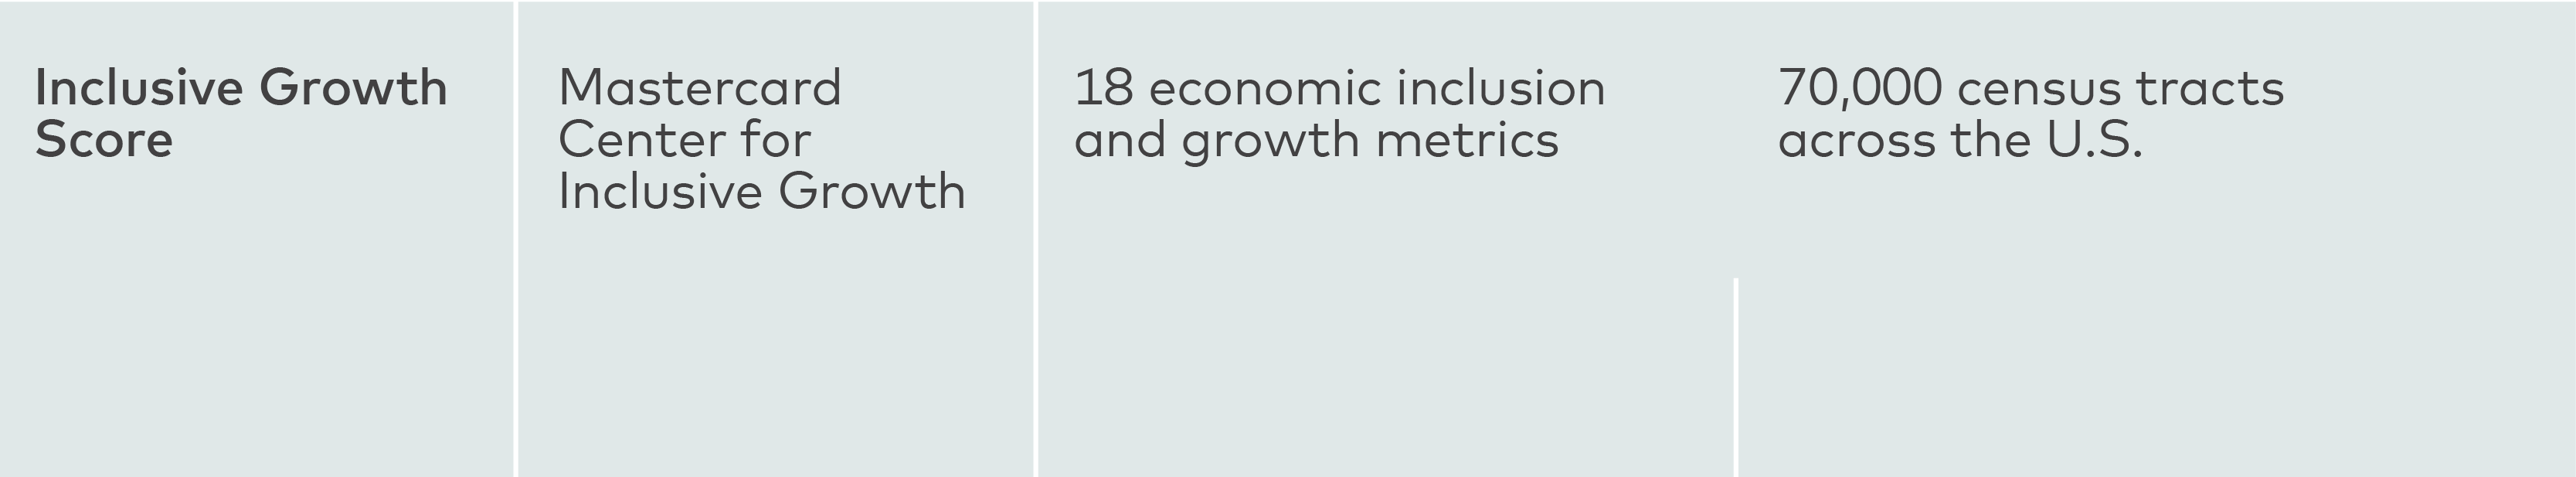
Inclusive Growth Score, Mastercard Center for Inclusive Growth. Presented by Arturo Franco, Smita Jain
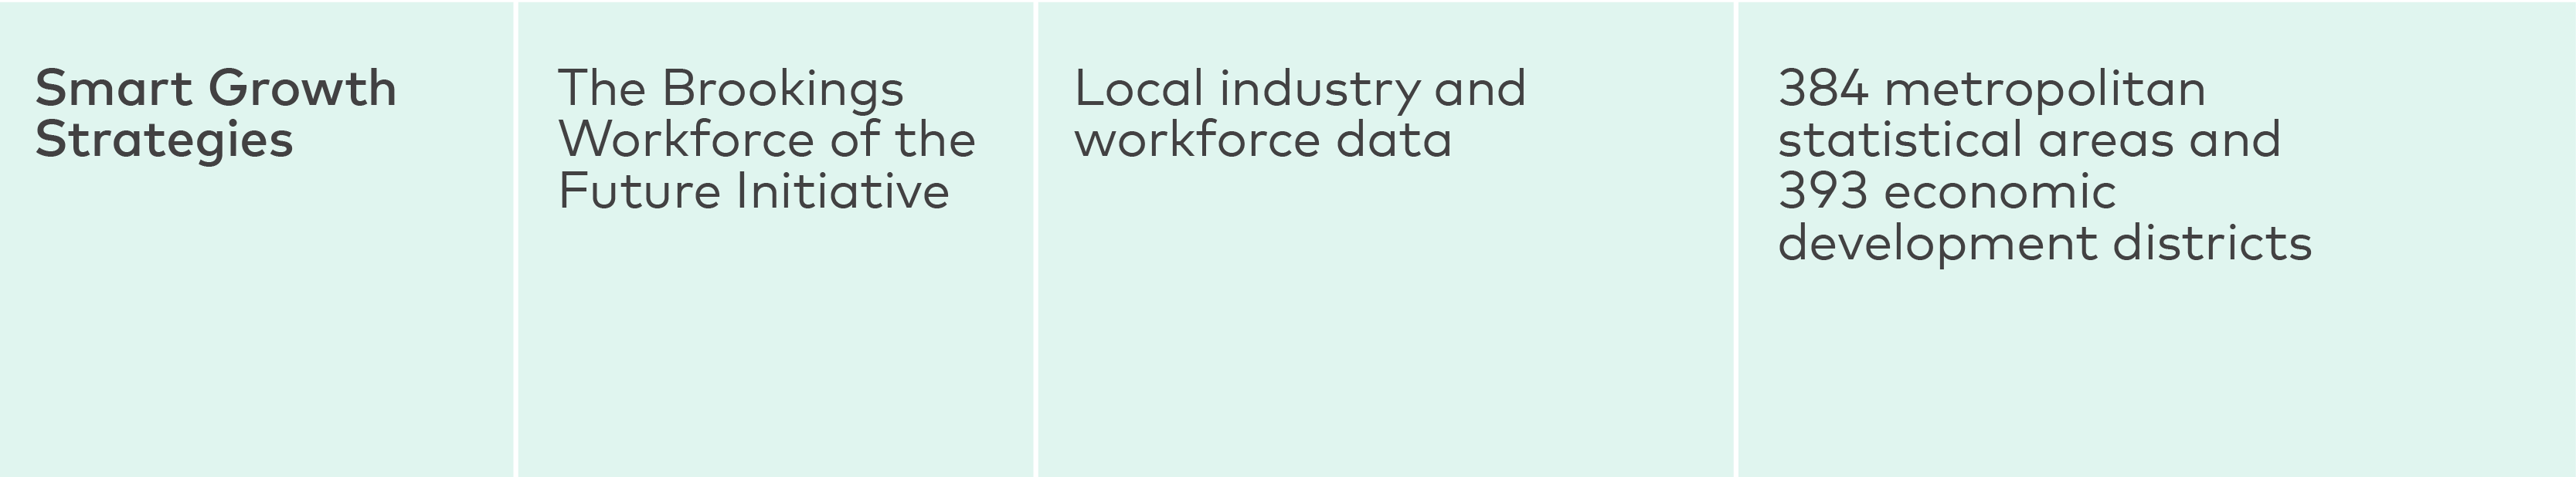
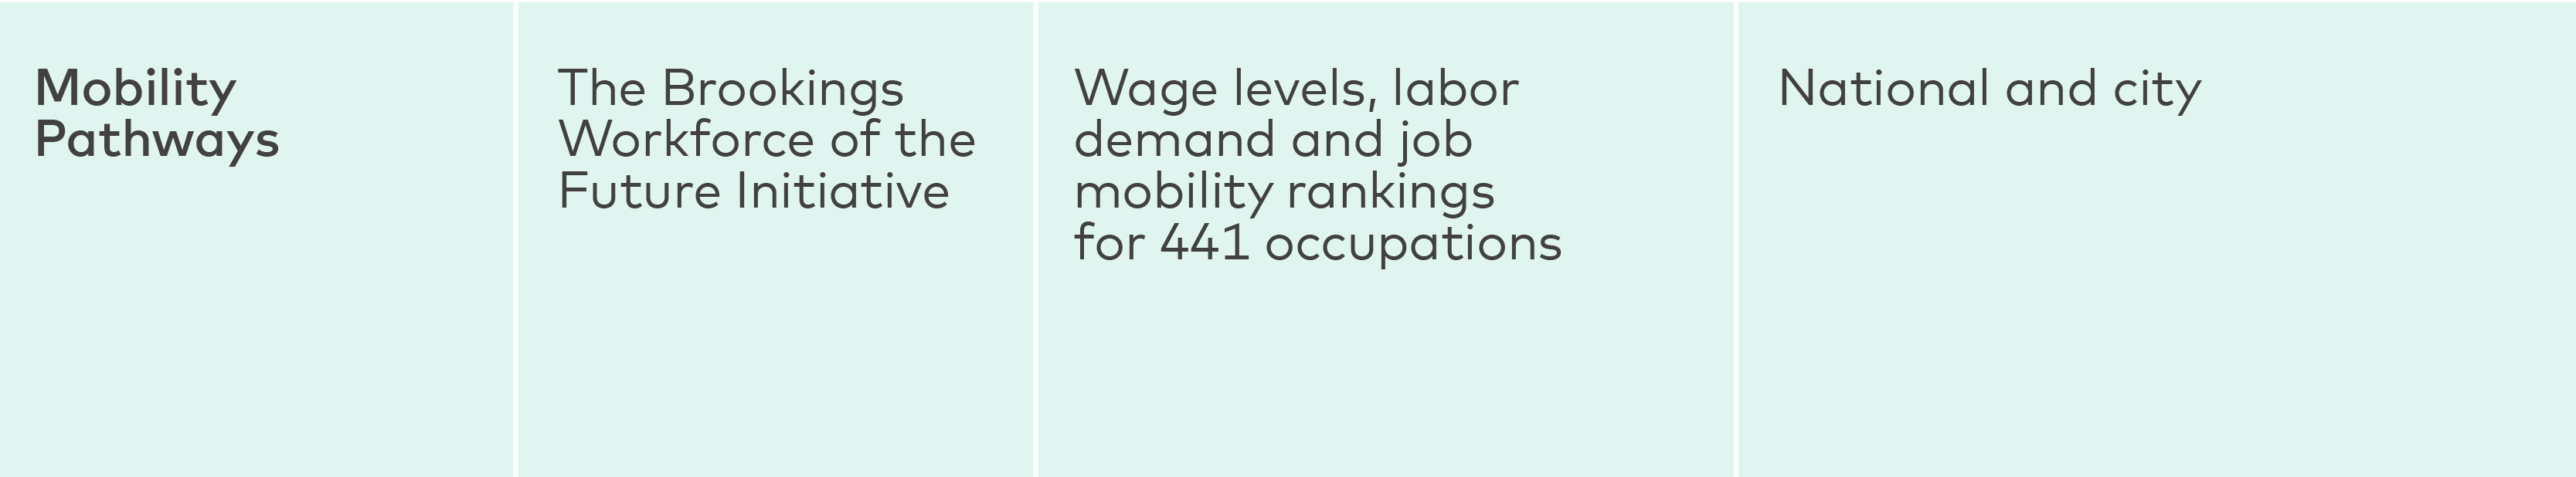
Smart Growth Strategies and Mobility Pathways, Brookings Institution. Presented by Greg Wright, Ian Seyal, Alex Cordero
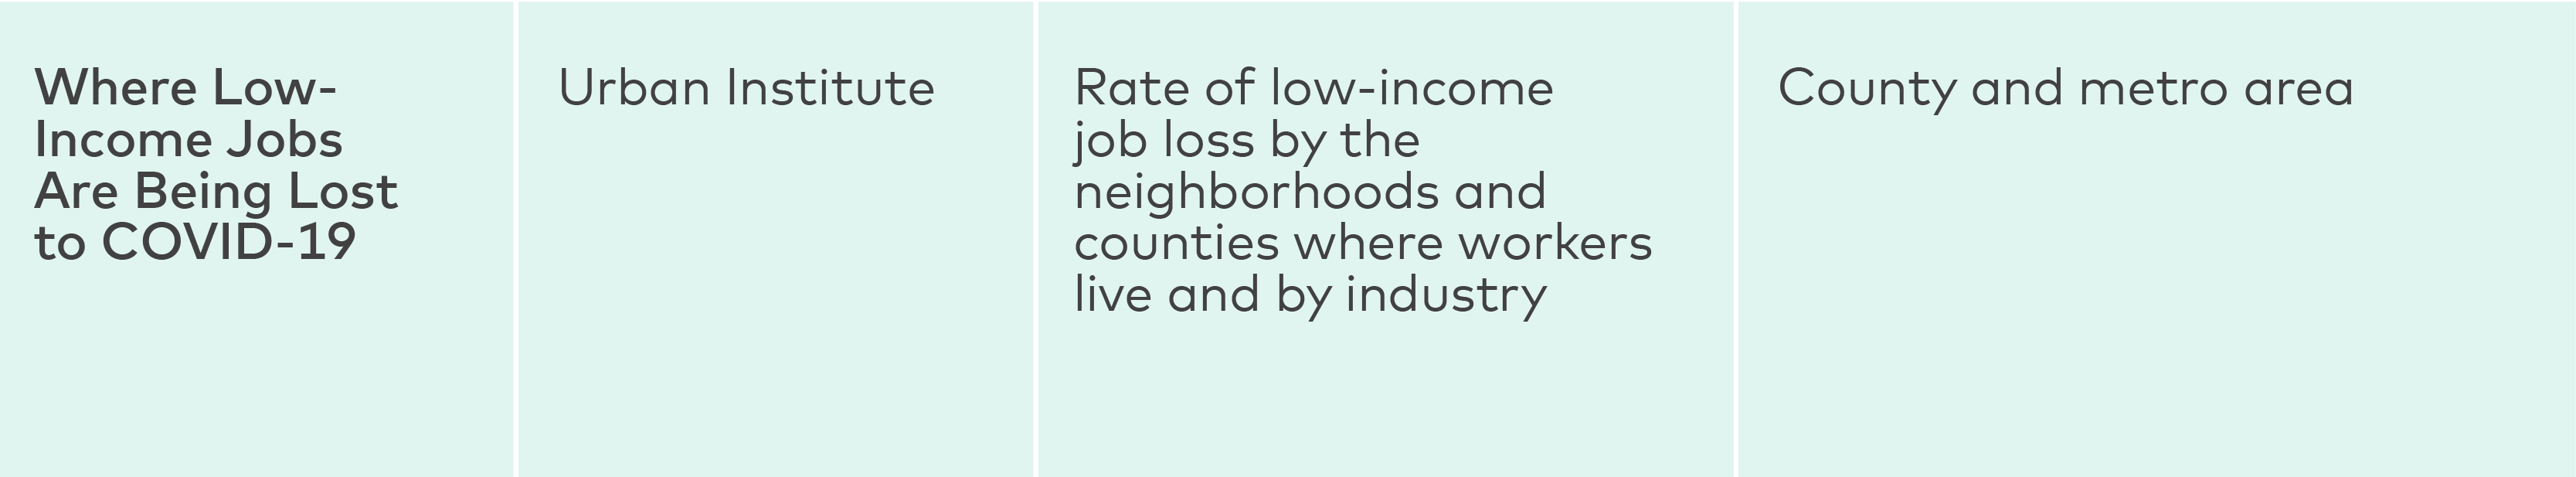
Credit Health during the COVID-19 Pandemic and Financial Health and Wealth Dashboard, Urban Institute. Presented by Miranda Santillo, Oriya Cohen, Kassandra Martinchek
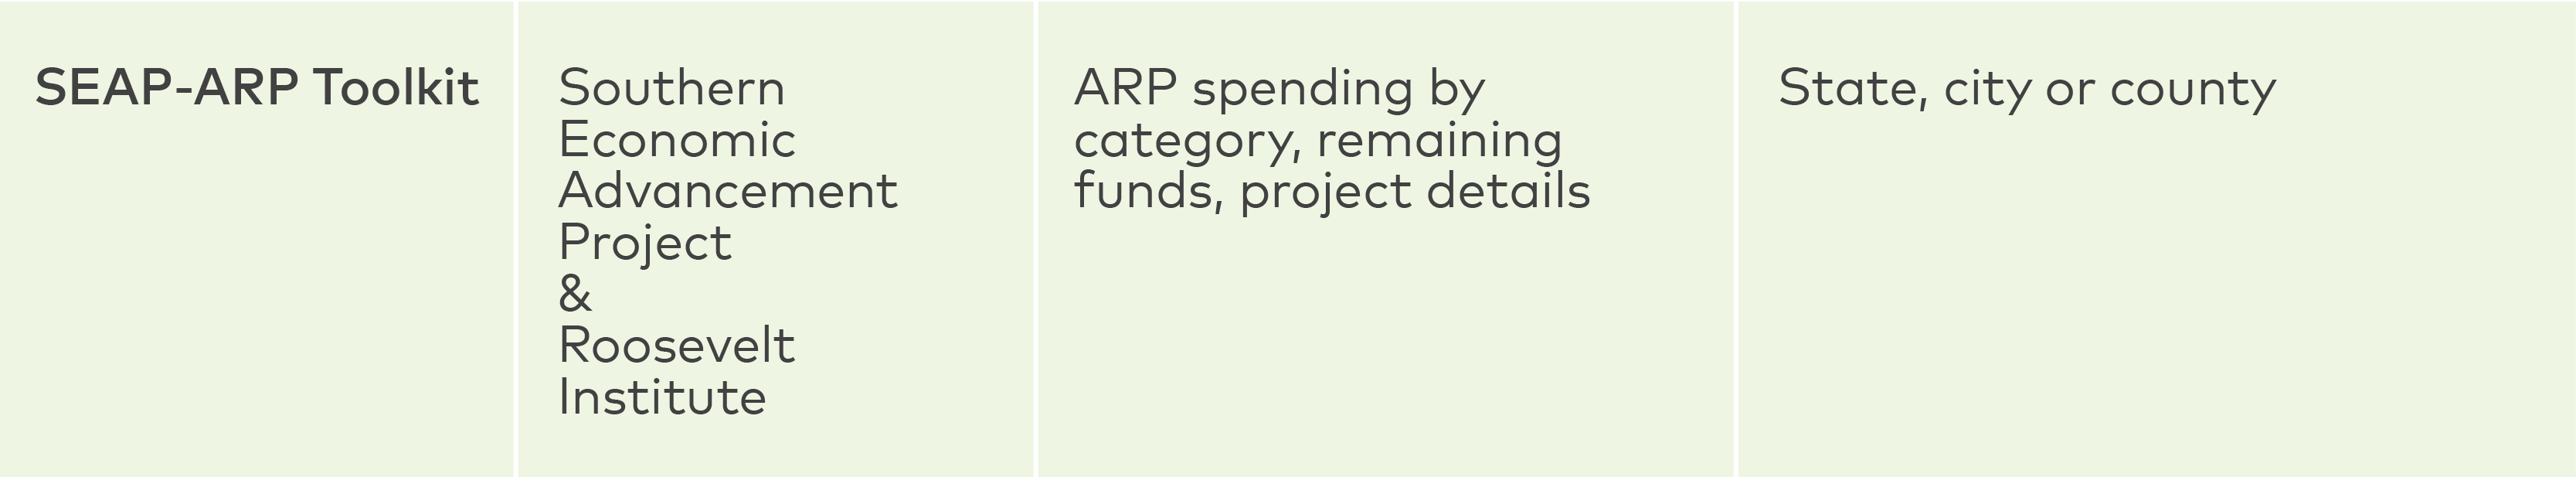
American Rescue Plan Toolkit and city budget case studies, The Southern Economic Advancement Project. Presented by Sara Beth Gehl
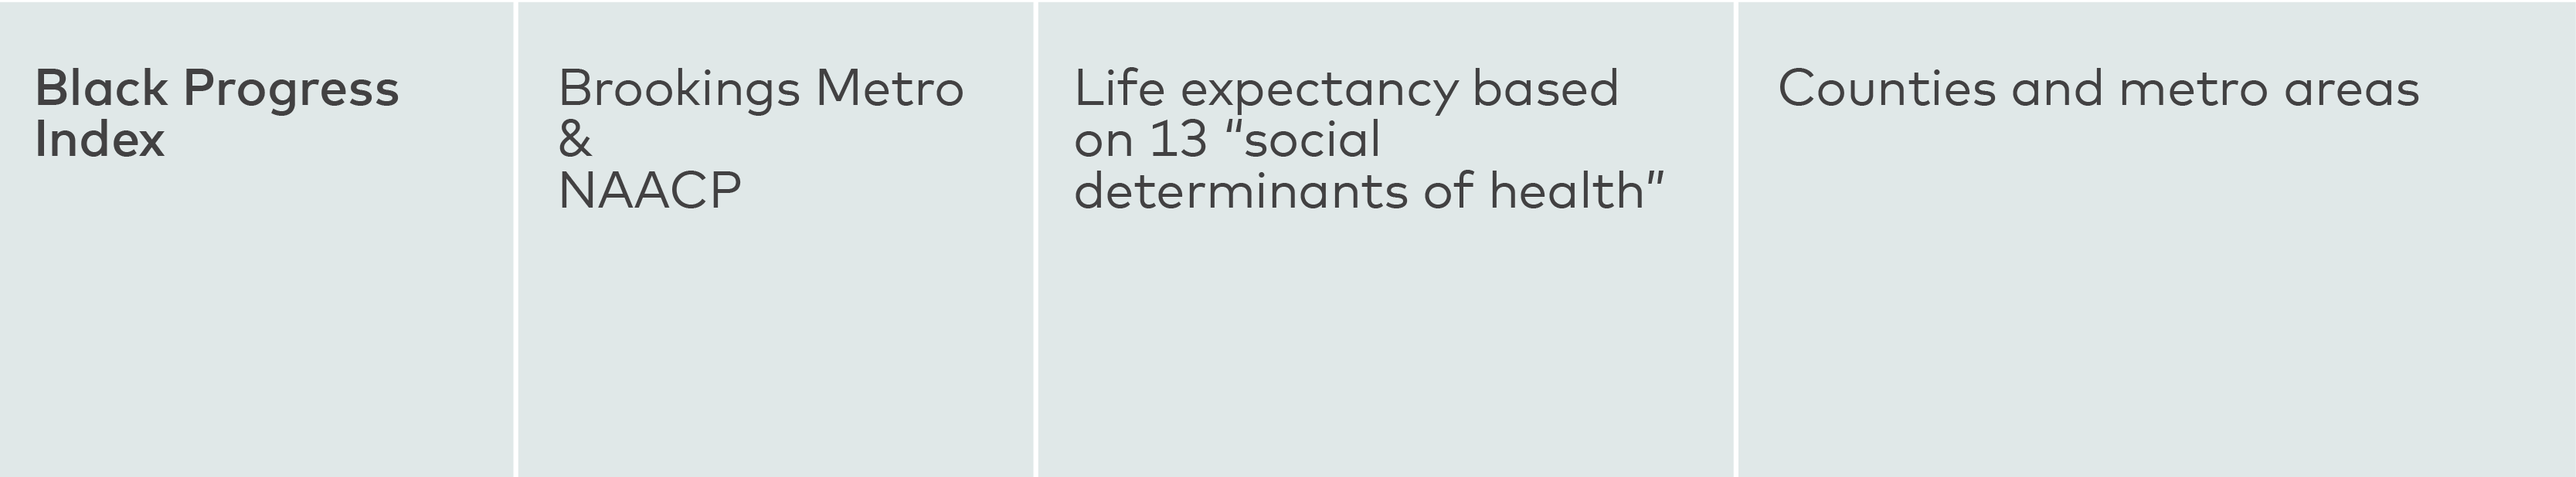
The Black Progress Index, Brookings Metro and NAACP. Presented by Dr. Andre Perry
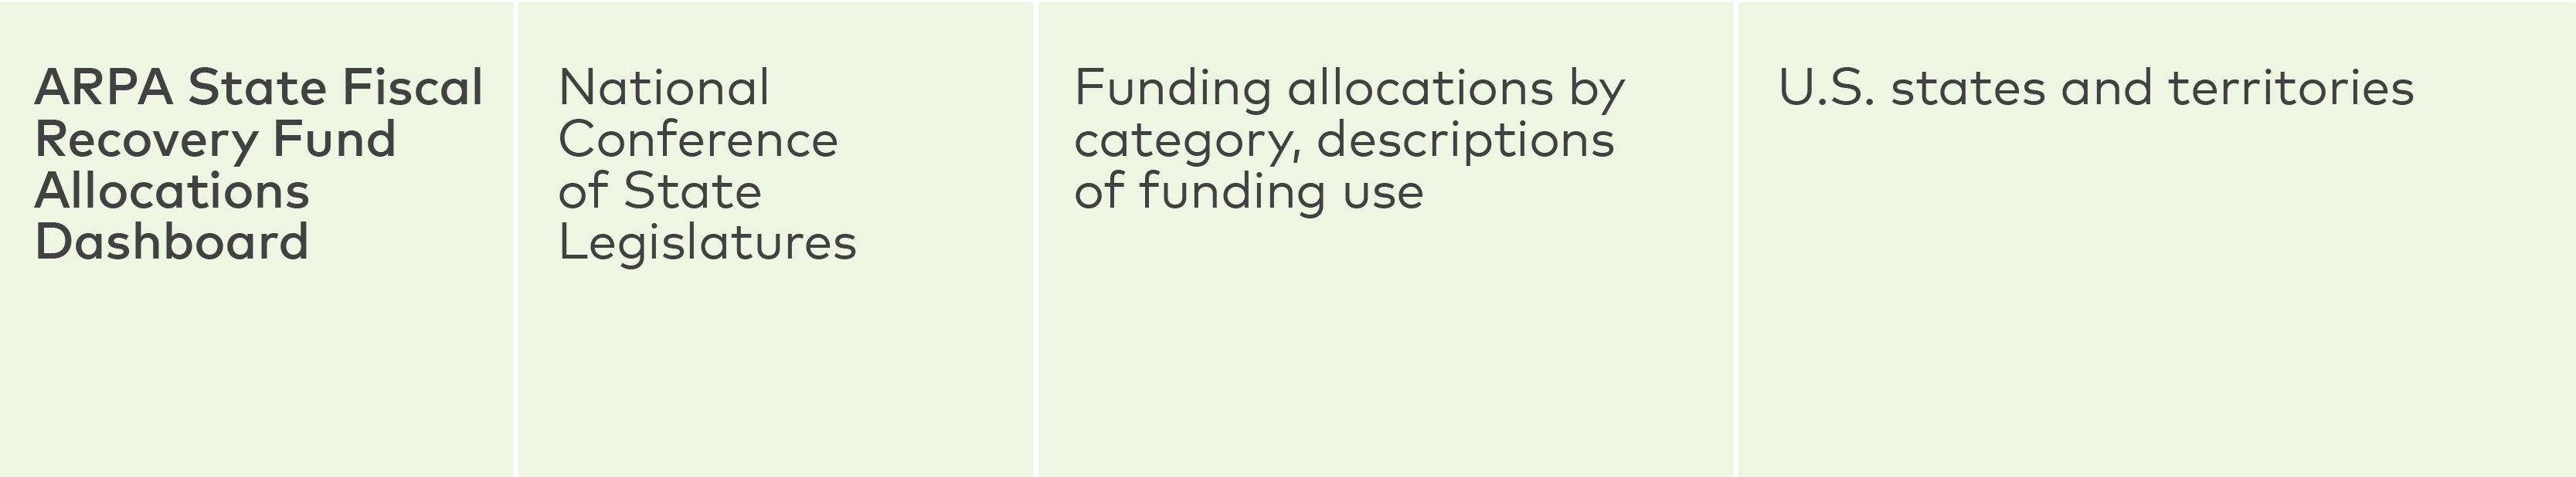
ARPA State Fiscal Recovery Fund Allocations Dashboard, National Conference of State Legislatures. Leo Garcia
Innovative Finance Playbook, maximizing federal funding (ARPA, IIJA, etc.) and best practices for braided funding, Accelerator for America. Presented by Mary Ellen Wiederwohl, Rachel Reilly, Ian O’Grady
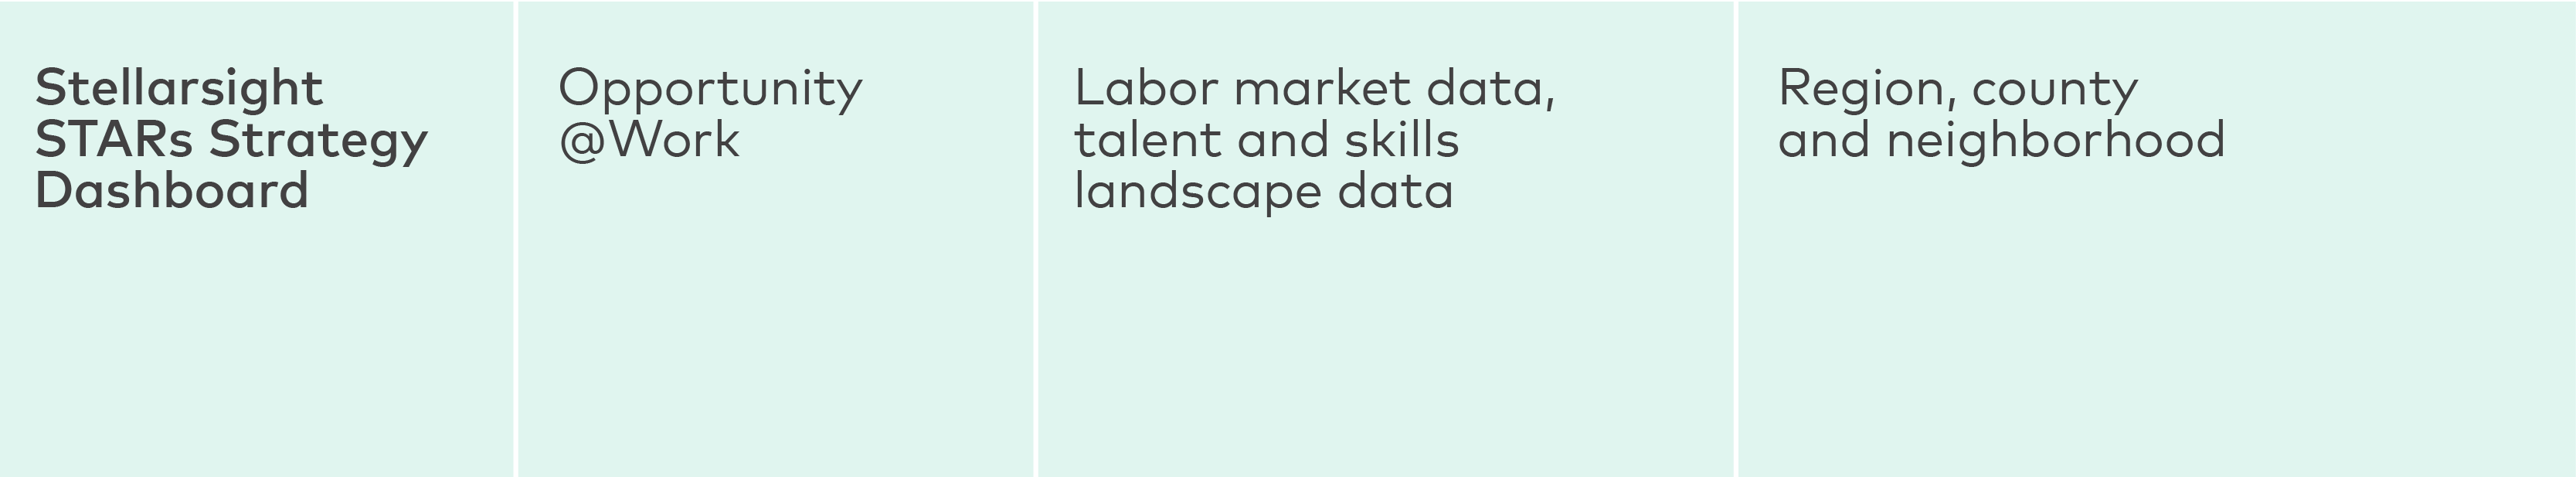
Stellarsight STARs (Skilled Through Alternative Routes) Regional Dashboard, Opportunity@Work. Presented by Papia Debroy, Georgia Gillette, Audrey Mickahail, Rachel Providence
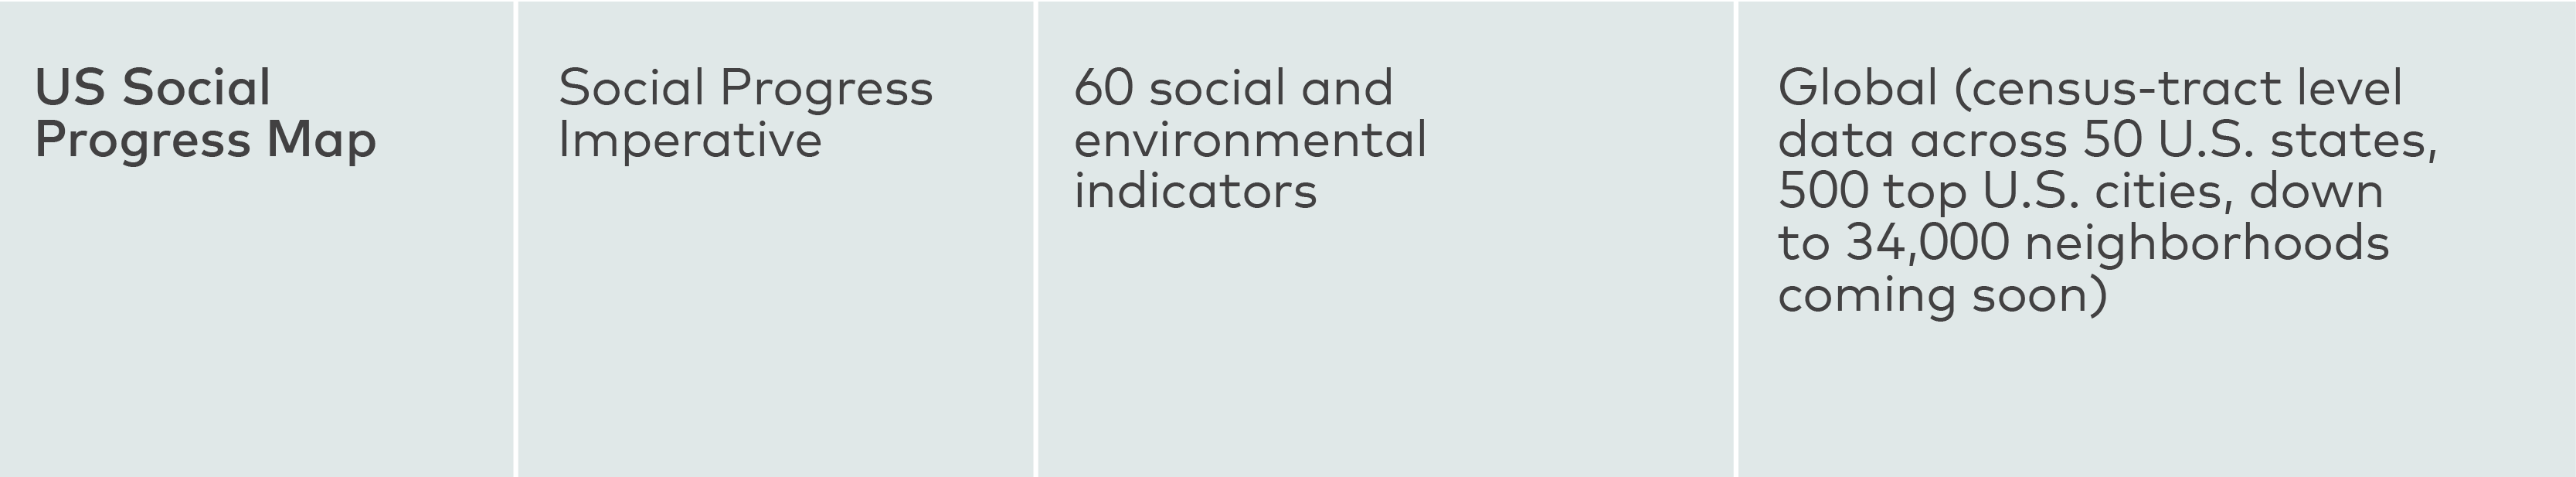
Social Progress Index, Social Progress Imperative. Presented by Emmanuel Frimpong Boamah
Through Data for Equity, these experts had the opportunity to share their tools with intended users – city employees – in a forum that also allowed for feedback and discussion. Cohort members were able to ask questions about how data presented in tools factored in or intersected with other equity metrics, such as social determinants of health and residents’ lived experience.
Data tool developers shared that they do not have many chances to see their tools in action or to hear directly from end users, and this program helped bridge that gap. Furthermore, many presenters commented on how beneficial it was to be able to speak directly to cities about how they could get the most information out of their tools during workshop sessions and subsequent office hours. Some developers shared that they would incorporate feedback from participants into future iterations of their data tools.
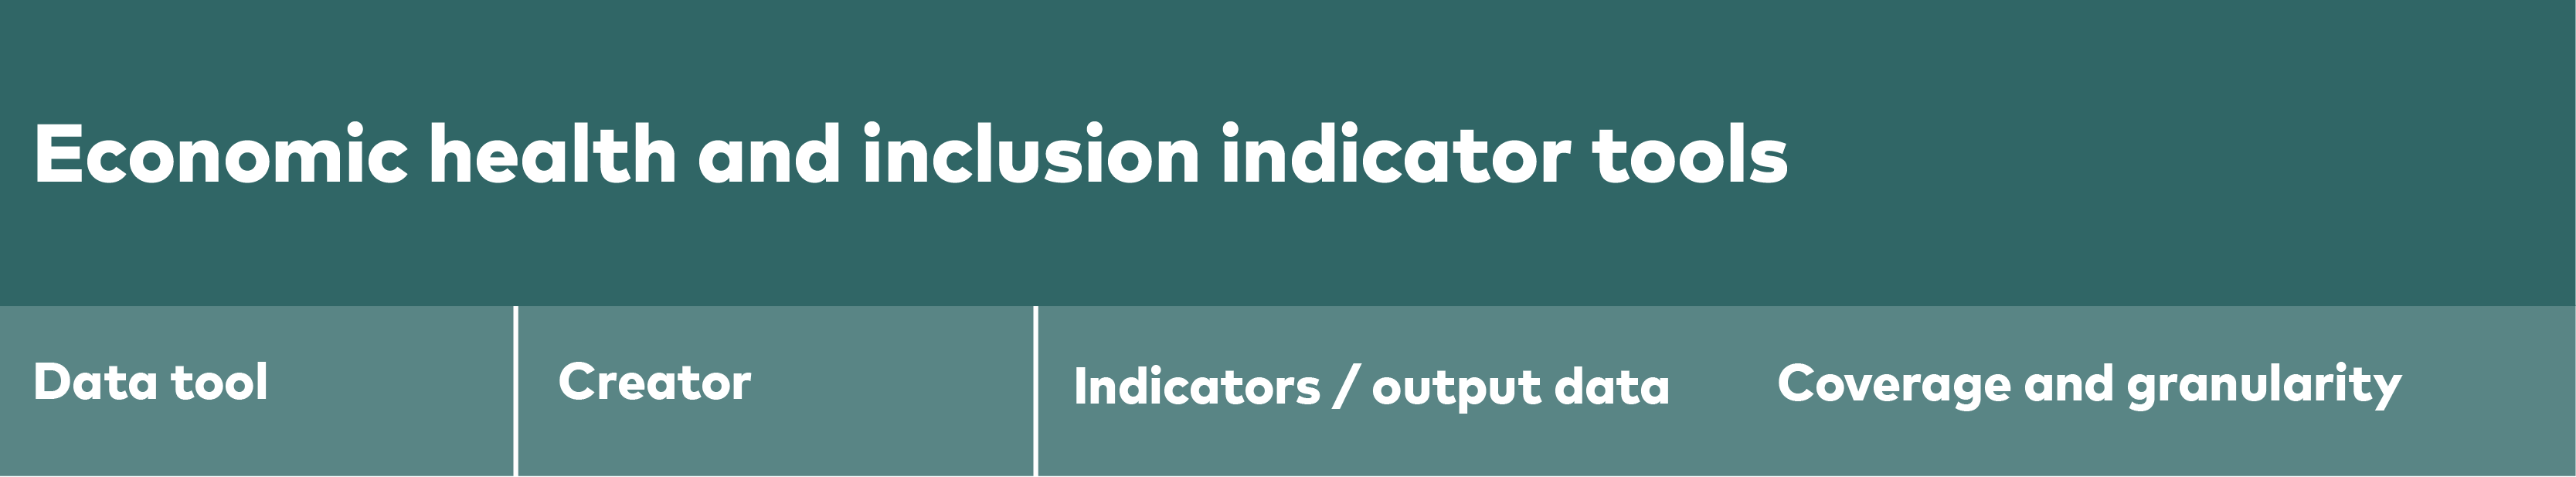
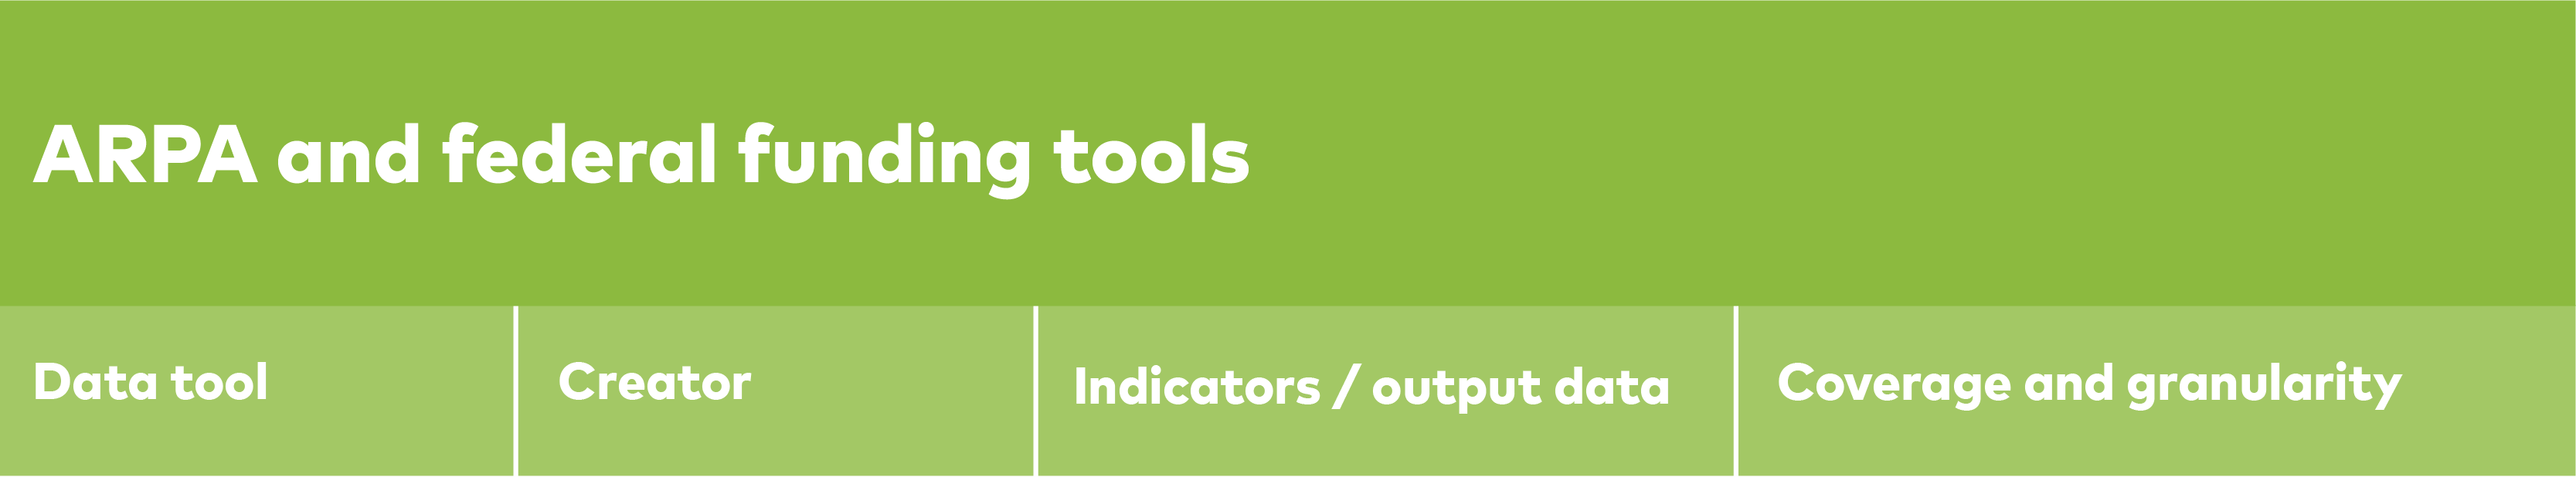
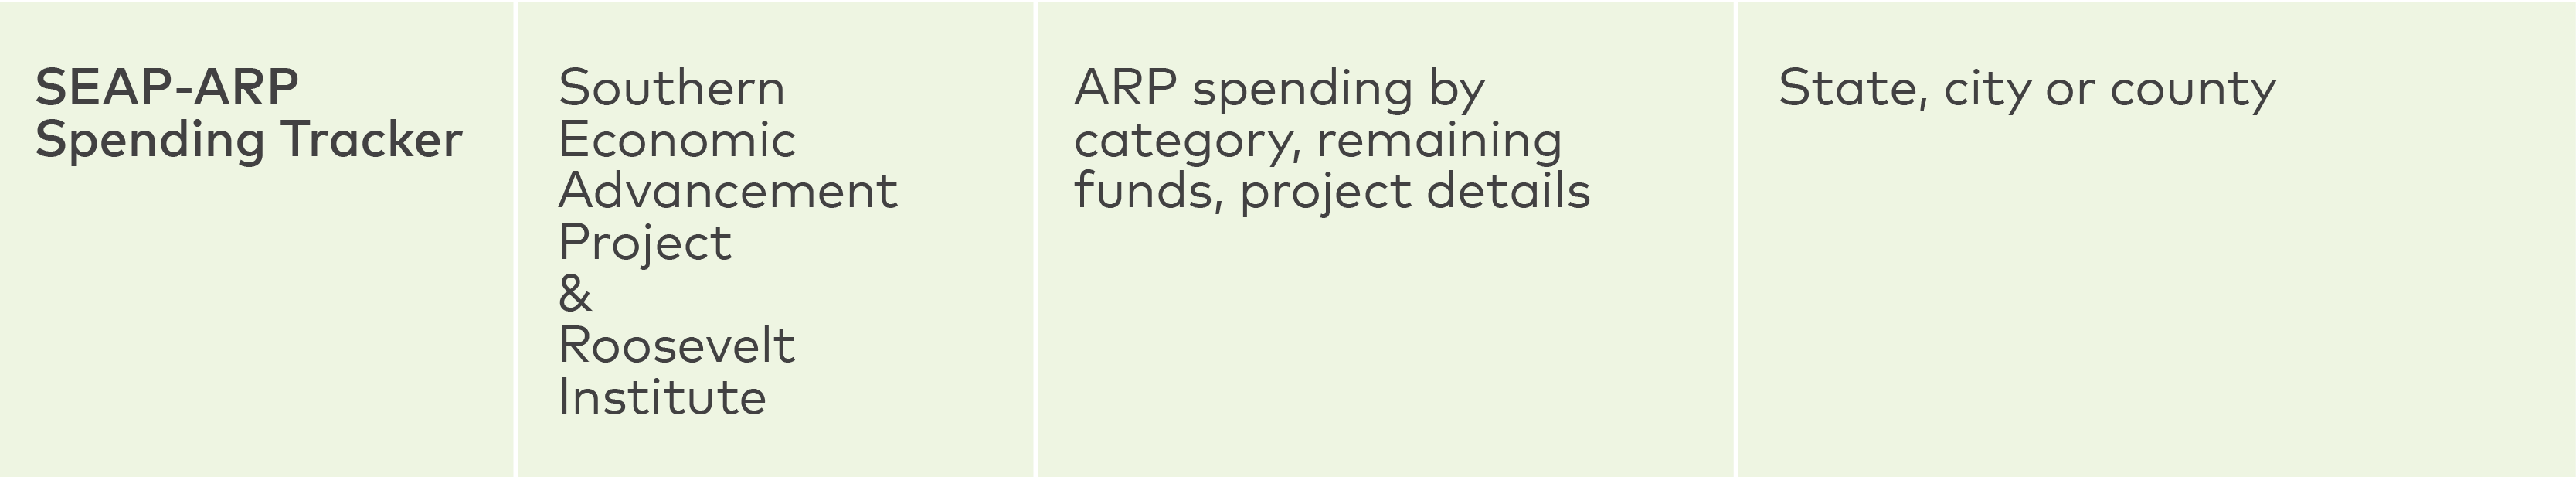
The table below highlights all the tools that participants were introduced to, further information on the tools can be found in the Data Tool Playbook. The presented data tools are categorized as follows:
Economic health and inclusion indicators
Workforce and job industry
ARPA and federal funding
Urban space and environmental
Personal finance
Broadband access
It is important to note the absence of racial and gender equity focused tools in this list. While this topic can be cross-cutting, and thus present as a factor within the other categories of tools, it is key to include specific racial and gender equity tools going forward.


Download the Data Tool Playbook.
CPI collected feedback from cohort participants throughout the program, sending surveys immediately after each session and noting recommendations made in group meetings, reflection activities, and final deliverables. There were several common themes that emerged from participant feedback, detailed below.
The Data for Equity program presented several key themes, including but not limited to racial equity, inclusive economic growth, opportunities for federal funding, and the importance of pairing qualitative with quantitative data in problem-solving. These themes provided a foundation to discuss how data tools can be applied to racial equity and economic investment work.
Cohort teams especially valued discussion themes that situated data tools within the broader social and community context and those that addressed residents’ lived experiences. While this program did not focus on community engagement best practices or plans, participants expressed that data tools should be used alongside ongoing and effective community engagement.
Team member - Atlanta, Georgia“Community engagement is essential to obtaining trust, input, and buy-in from the people who are most impacted by the plans, policies, and systems that are developed for their benefit.”
Participants also recognized the power that the government has to shape people’s lives. Because of this power, they realized the importance of building strong, trusting relationships with residents to create the best opportunities and outcomes.
Team member - Atlanta, Georgia“Government leaders have the tools, policy and program levers, and decision-making power to influence financial well-being at the local level and help narrow the racial wealth gap.”
The link between racial equity and economic equity was especially important to participants. Several teams noted the importance of a historical and systems-level understanding of why and how inequities exist alongside economic conditions.
Many existing equity efforts in cohort cities use federal funding opportunities, such as the American Rescue Plan Act, to build capacity and shore up aging city systems. Participants highlighted data tools and discussion themes that explored how strategically leveraging funds is essential to inclusive and equitable urban and economic development.
Team member - Salt Lake City, Utah“One of the things I learned by using federal funds associated with the American Rescue Plan Act is that when economic equity is a priority, it challenges an agency to understand its community, direct outreach, and find the data that will show impact.”
Participants expressed a strong interest in learning how to move from diagnosing challenges to identifying and iterating solutions. More than half of cohort cities cited the Built for All framework for inclusive economic growth, developed by CFIG and the Centre for Public Impact, as particularly useful because it creates a strategic foundation for how to address racial and economic equity.
Teams also looked to each other for solutions and ideas, especially concerning how to de-silo equity work. Several city teams expressed interest in how other cities have incorporated an equity lens across city services and departments. They also noted that data tools can facilitate inter-agency coordination by helping identify connections and opportunities to collaborate, and providing insights into department-specific challenges from an equity perspective. As they figured out the next steps, almost every city included a plan to share specific tools with other departments.
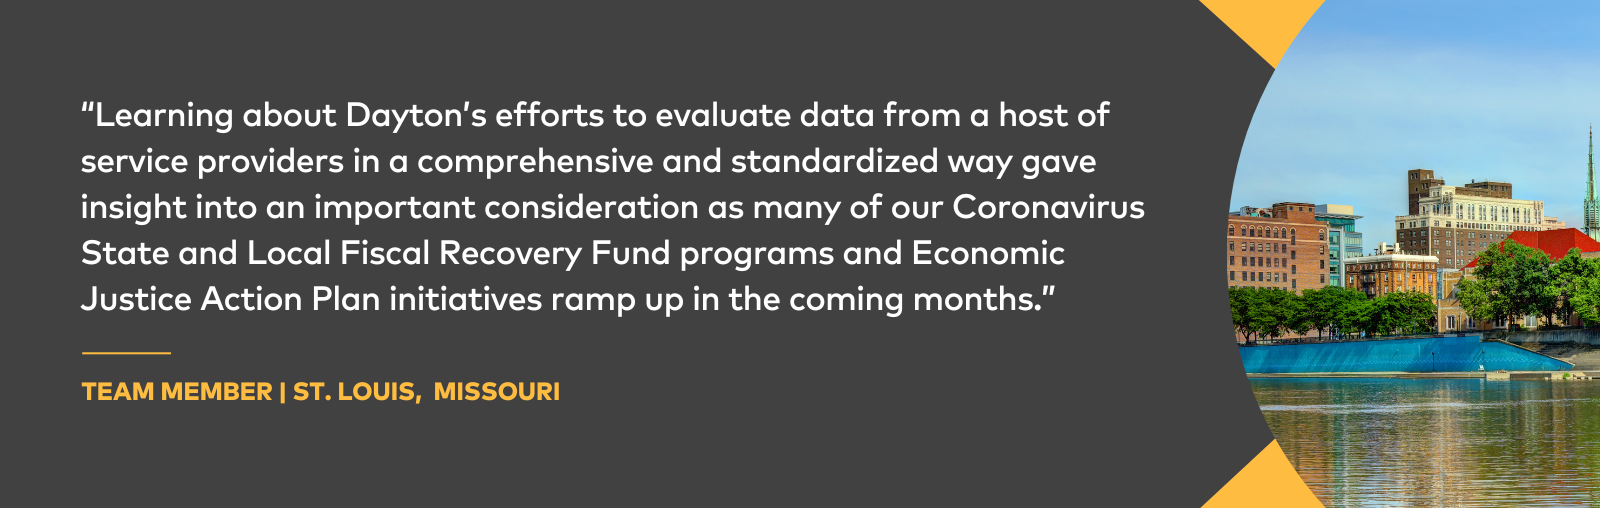
Team member - St. Louis, Missouri“In our discussions with other cities, it was interesting to compare and contrast our competencies, challenges, and priorities….We noted that other cities were able to address and move forward in certain areas which have been challenging for us, while also struggling in areas that haven’t been an issue for us.”
One important topic that cities emphasized was the importance of qualitative data. Information about residents’ lived experiences, root causes that may not be reflected in data tools, and local ideas for solutions (and potential pitfalls) are all essential for creating lasting change. Residents are also in the best position to speak to the community strengths and resources that are often left out of formal data collection.
Team member - Atlanta, Georgia“Qualitative data places quantitative data in context, it helps shift the conversation from problems to solutions, and creates more trust between communities.”
Being able to identify where disparities occurred and what populations are most affected is crucial to know where to allocate resources. It also has the potential to illuminate connections between issues or systems. However, it is only part of the picture and does not necessarily grant clear insight into the most effective solutions. For that, the impacted communities must be involved in the cocreating solutions.
Problem statement
Through Data for Equity, Atlanta will use data-driven frameworks and analytical tools to inform the prioritization and allocation of investments in key neighborhoods while leveraging policies to dismantle systemic inequities, as they continue Moving Atlanta Forward.
Background
Atlanta, Georgia’s Data for Equity team recognized that the city’s history of legalized discrimination has produced ongoing inequities, especially for Black residents. According to the National Equity Atlas, Atlanta currently has the highest level of income inequality between the highest and lowest earners of any major American city. The Atlanta area also has a high level of racial inequity in income, which significantly limits its overall GDP. Disparities in wealth and access to capital contribute to disparities in quality of life and economic and educational opportunities.
Atlanta’s population has grown significantly in recent years. With this growth come new opportunities for economic development, including new and expanding job sectors and infrastructure improvements. As the City of Atlanta invests in inclusive infrastructure and economic opportunities for residents, the Data for Equity team explored how data tools can help target investments for historically marginalized and underserved communities.
The City of Atlanta’s 2021 Comprehensive Development Plan outlines several plans and initiatives that “create a framework for equitable, inclusive and accessible” pathways to wealth and economic growth for residents. Policy actions include launching an Equitable Growth Grant program, creating and maintaining a public equity dashboard to ensure equitable investment resulting from public resources, and supporting inclusive and mixed-income communities.
As a result of voter ballot initiatives in Spring 2022, the Moving Atlanta Forward strategic plan invests in system and infrastructure improvements including education, workforce development, building and transportation construction and repair, and sustainable industry development. This plan, which incorporates an equity lens into some of its programming, informed how the Atlanta team approached Data for Equity.
Atlanta’s team included the city’s Chief Equity Officer, the Chief Equity Officers of economic development corporation Invest Atlanta and nonprofit partner Atlanta Beltline, and staff from city departments including the Office of Equity, Diversity and Inclusion, Office of Innovation and Performance, and Department of Parks and Recreation.
Challenges and ideas
Atlanta recognized the importance of acknowledging both historical and present-day marginalization of Black and Brown communities, and focused their learning journey on how data tools could help the city target resources to these communities.
They also stressed the importance of using what they learned through this experience to “inform” future efforts, rather than make unilateral decisions without resident involvement.
Participants from Atlanta discussed how learnings from this program could be used across the city government, not solely in explicitly equity- and data-oriented roles, while also understanding that these learnings might not apply in the same way across all areas.
Tools
Atlanta’s team was particularly interested in tools that help them identify where to target economic investments and how to connect residents to employment opportunities. Knowing that economic indicators alone do not tell the full picture of a community, they noted tools that could also help place indicators within the larger social context.
Inclusive Growth Score, Center for Inclusive Growth
Smart Growth Strategies, Brookings
Black Progress Index, Brookings Metro
Data Labs Playbook, Beeck Center
Stellarsight STARs (Skilled Through Alternative Routes)Regional Dashboard, Opportunity@Work
In addition to tools that help identify key economic indicators and target areas, the Atlanta team identified tools that explored more complex aspects of residents’ lived experience, intersections of community needs and assets, and opportunities to engage with residents.
Social Progress Index, Social Progress Imperative
NYC Equitable Development Data Explorer, New York City Department of City Planning
Next steps
Following their Data for Equity journey, the Atlanta team decided that establishing an Equity Data Council would help create an inclusive economy by “approach[ing] equity analysis work in a cohesive manner city-wide” that would also account for differences between departments’ focus areas and unique needs.
The proposed Equity Data Council would:
Include Data for Equity participants and other relevant staff from across city government.
Develop a city-specific data tool repository complete with messaging about how each department could apply tools to their needs.
Propose a new approach to standardizing data use across departments, informed by the tool repository.
Following the establishment of the Equity Data Council, the team intended to create a citywide Strategic Equity Plan, inspired in part by what they learned from other cities in the cohort.
Problem statement
Through Data for Equity, Baltimore will identify data, tools, and resources to increase transparency and accountability, ultimately improving the access and affordability of services, distribution of funds and resources, and recruitment and retention of a strong workforce.
Background
Baltimore, Maryland’s Data for Equity team considered how past racist policies continue to affect residents’ well-being, including access to economic and educational opportunities. Like Atlanta, Baltimore has a high rate of income inequality among residents according to the National Equity Atlas.
Recognizing the ongoing impact of past policies, the city government has taken a strong stance in recent years to integrate a racial equity lens across its services and programs. The 2018 Baltimore Equity Assessment Ordinance included a series of measures that required each city agency to incorporate equity assessments and reports into regular operations and review processes. The Office of Equity and Civil Rights is currently developing an “equity dashboard” to track and share data on the progress and impact of these processes.
As the city has taken steps to incorporate equity frameworks across its services, the Data for Equity team recognized that data tools could serve an important role in both program design and evaluation. In addition, they saw an opportunity to advance the City’s mission to improve transparency and accountability about its performance by identifying relevant data tools and analysis frameworks.
The Baltimore Data for Equity team used the pillars of the 2021 Building a Better Baltimore plan to guide their problem statement and how they thought about addressing historic disinvestment in Black communities. The pillars include Building Public Safety, Prioritizing Youth, Clean and Healthy Communities, Equitable Neighborhood Development, and Responsible Stewardship of City Resources.
Baltimore’s team included the city’s Chief Equity Officer, the Director of Equity in the Police Department, Acting Chief of the Office of Equity and Environmental Justice, and staff from departments including the Department of Recreation and Parks and Department of General Services.
Challenges and ideas
Baltimore’s team noted the importance of describing how historical factors connect to the current racial disparities reflected in data tools. Current disparities do not happen in a vacuum, and investing in underserved and marginalized communities can help dismantle ongoing structural injustices. The team observed that several other cities in the cohort face similar challenges.
Baltimore’s citywide Equity Assessment Ordinance was especially informative for other participants in the Data for Equity cohort. After learning how this ordinance is reflected in the Baltimore Police Department, Atlanta’s team noted that the framework is one example of how cities can develop a common language and set of practices and procedures around equity.
Tools
The Baltimore team was especially interested in data tools that provide specific information that can concretely build on existing equity analysis work, including through the Office of Employment Development and the city-wide equity dashboard.
Stellarsight STARs (Skilled Through Alternative Routes) Regional Dashboard, Opportunity@Work.
Inclusive Growth Score, Center for Inclusive Growth
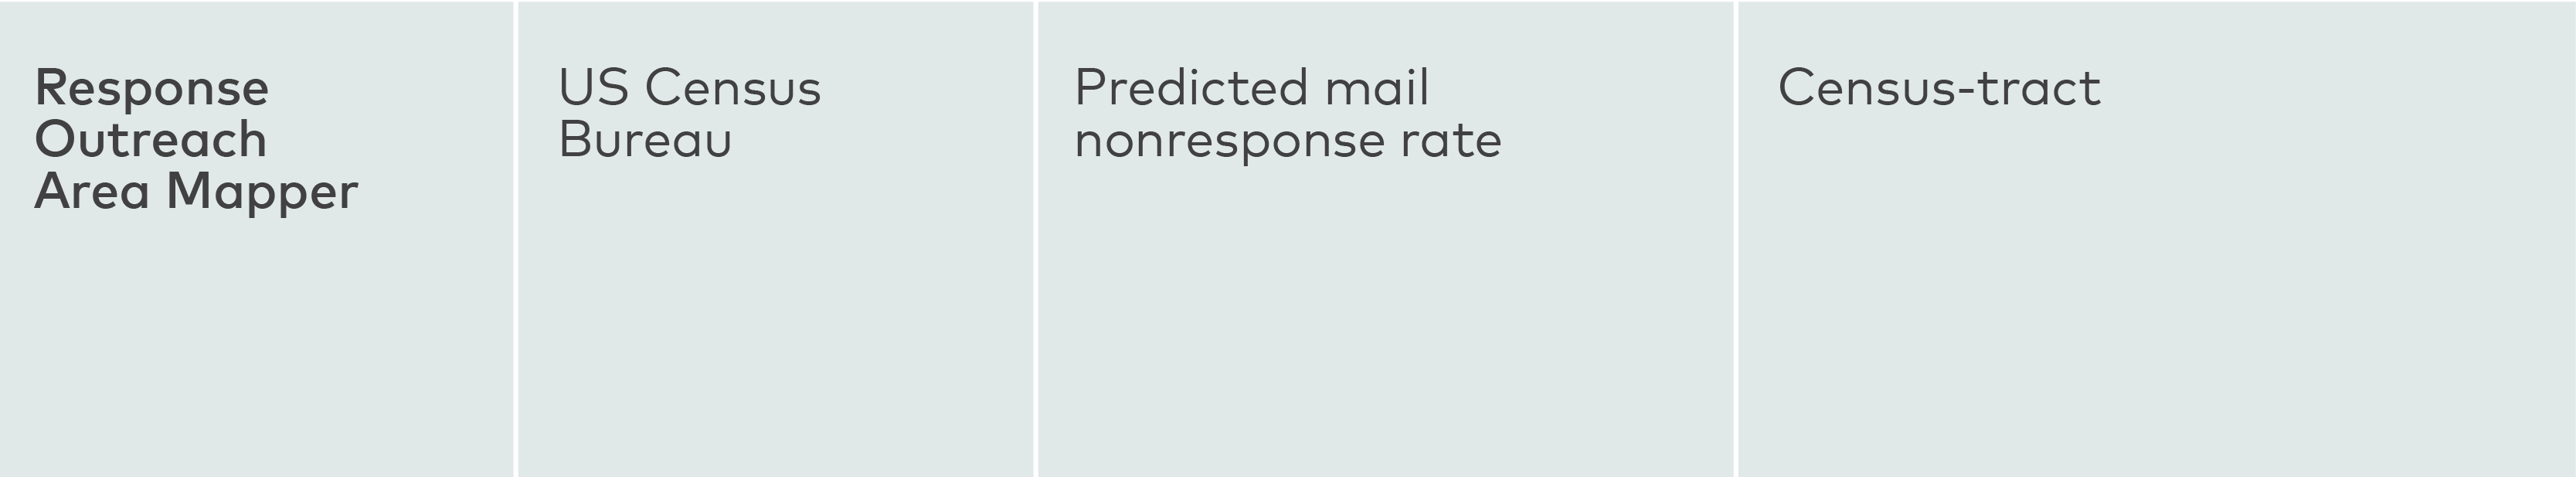
Response Outreach Area Mapper, US Census Bureau
ARPA Tool Kit, Southern Economic Advancement Project
Next steps
The Baltimore team was especially interested in assessing the equitable distribution of all city funds, including the operating budget, capital budget, and ARPA funds. Beyond funding allocation, the team planned to further support the city’s equity efforts by sharing the tools they learned about with agency leaders, equity coordinators, and other key stakeholders, as well as incorporating learnings into their own work.
Baltimore’s team considered a number of options to ensure this effort would be effective for stakeholders’ specific contexts. Their plans included:
Showcase especially relevant datasets and tools to the mayor and his cabinet.
Compile a tool repository to share with stakeholders.
Hold a Data for Equity team reflection session to determine how to collaborate across participants’ respective departments and roles going forward.
Incorporate more data visualizations into the Office of Equity and Civil Rights’ Equity Dashboard, based on what they learned from data tools in this program.
Problem statement
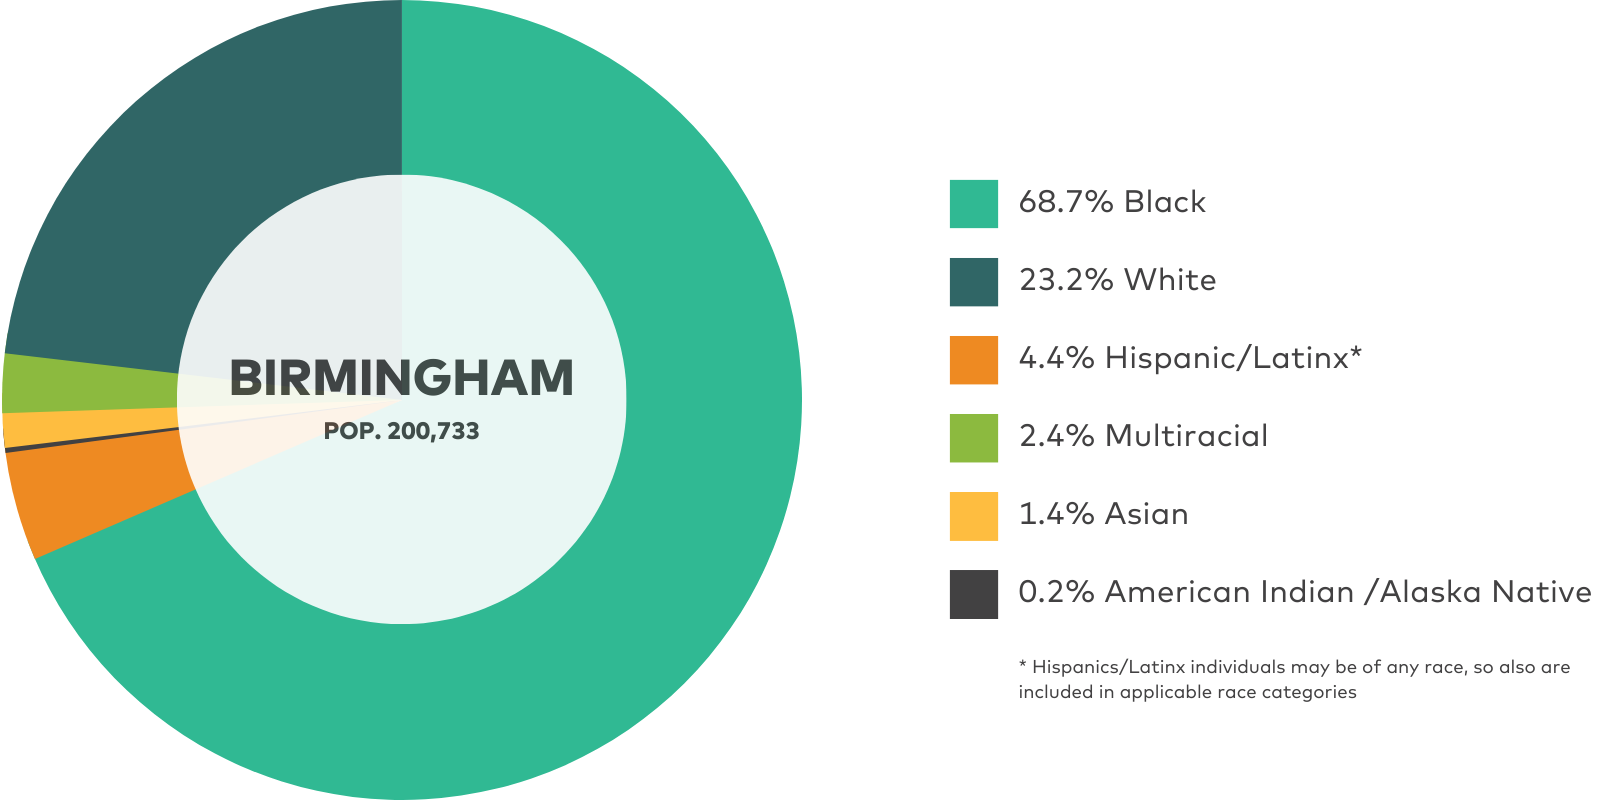
Through Data for Equity, Birmingham will use data to drive rapid, disruptive, just, simple, and effective place-based response and development in devalued neighborhoods.
Background
Birmingham, Alabama has focused significant equity efforts toward addressing the legacy of historical racism toward creating new economic opportunities for historically marginalized groups.
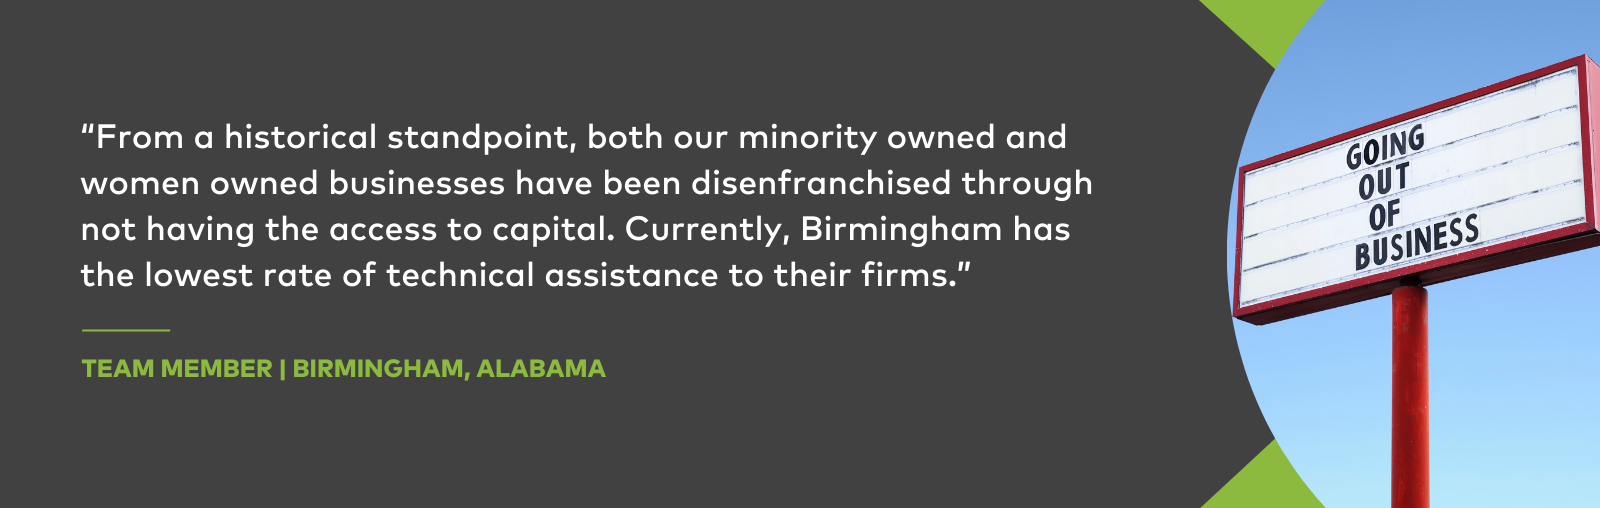
To address this legacy of disenfranchisement, the city has made a concerted effort to create equitable access to economic opportunity for residents. According to the Urban Institute, as of 2020, Birmingham ranked as the 68th most racially inclusive city out of 274 United States cities, in the top quartile for racial inclusion. Birmingham has also significantly improved its racial poverty gap, from 21 percentage points in 1980 to 11 points in 2016.
A significant component of this improvement has been inclusion-oriented initiatives that expand business opportunities for local minority-, women-owned and disadvantaged business enterprises (MWDBEs), spearheaded by the Department of Innovation and Economic Opportunity. For example, the Building Opportunities for Lasting Development (BOLD) Funding Program distributes funding to support programs that advance economic resilience and mobility, and “build an ecosystem that allows innovation and opportunity that supports the growth of MWDBEs.”
The city has conducted a disparities study to identify businesses’ access to opportunities and their experiences conducting business with the city. Over the next year, the City will be implementing findings and recommendations to remedy disparities in the ecosystem.
Economic development is not the only area where the city is working to advance equity. Established by the mayor’s office in 2019, Birmingham’s Division of Social Justice and Racial Equity’s mission is to “employ social justice as a core principle in City of Birmingham policies, operations and decision-making” Among its goals, the department aims to “Address community inequities affecting under-served residents through an equity lens” and “Create access for residents to engage city government.”
The City of Birmingham’s focus on making the local economy more inclusive and diverse by improving opportunities for MWDBEs provided a clear framework for the Data for Equity team, and they set out to integrate learnings from the workshop into existing initiatives and plans.
Birmingham’s team included the Deputy Director and other staff from the Department of Innovation and Economic Opportunity, as well as staff from the Mayor’s Office.
Challenges and ideas
Even before the conclusion of the program, Birmingham’s team reported that they were using data to strengthen the case for equity-oriented decisions. Having clear data allowed them to show how and why certain communities need specific resources, and that economic development efforts were not arbitrarily or unfairly favoring them. In addition, members of the team reported that they had started sharing tools from the program to inform an initiative to address healthy food access.
Their approach to the program also informed how other teams thought about equity work. Atlanta’s team noted that Birmingham’s use of the word “disruptive” in their problem statement was particularly informative, as it was chosen to “intentionally step away from the status quo that agencies can become steeped in, and instead they wanted to build innovative methods into their work.”
At the same time, the team recognized that a statement like this was only the beginning.
Birmingham’s team noted that other cities’ approaches to equity showed options for how they could further integrate racial equity into different operations across the city government. Seeing how many areas of city government were represented on other teams led team members to reflect on what other departments would benefit from an intentional and clearly defined equity lens. As a result, they resolved to bring what they had learned to colleagues in other departments.
Tools
In discussing which tools were most useful, the Birmingham team focused on tools that provided clear insights into where and how to bolster businesses and address wealth gaps. Tools with strategy recommendations, practical working definitions of terms like “equity” and “inclusion,” and guidance on applying them to specific contexts were especially helpful to contextualize tools’ information.
Inclusive Growth Score, Center for Inclusive Growth
Smart Growth Strategies, Brookings
Financial Health and Wealth Dashboard, Urban Institute
Data Labs Playbook, Beeck Center for Social Impact and Innovation, National Governors Association
Next steps
Birmingham’s team began incorporating learnings before the end of the program to inform ongoing work in the Department of Innovation and Economic Opportunity. They began using the Inclusive Growth Score to identify priority neighborhoods to include in the Empowered CItizens of Birmingham initiative, which engages residents in neighborhood cleanup and gateway planning efforts.
Having noted that several other cities have strategies to incorporate an equity lens into all planning and across departments, they began exploring options to share equity resources across city government and expand to other stakeholders.
Birmingham’s team plans to carry this forward included the following:
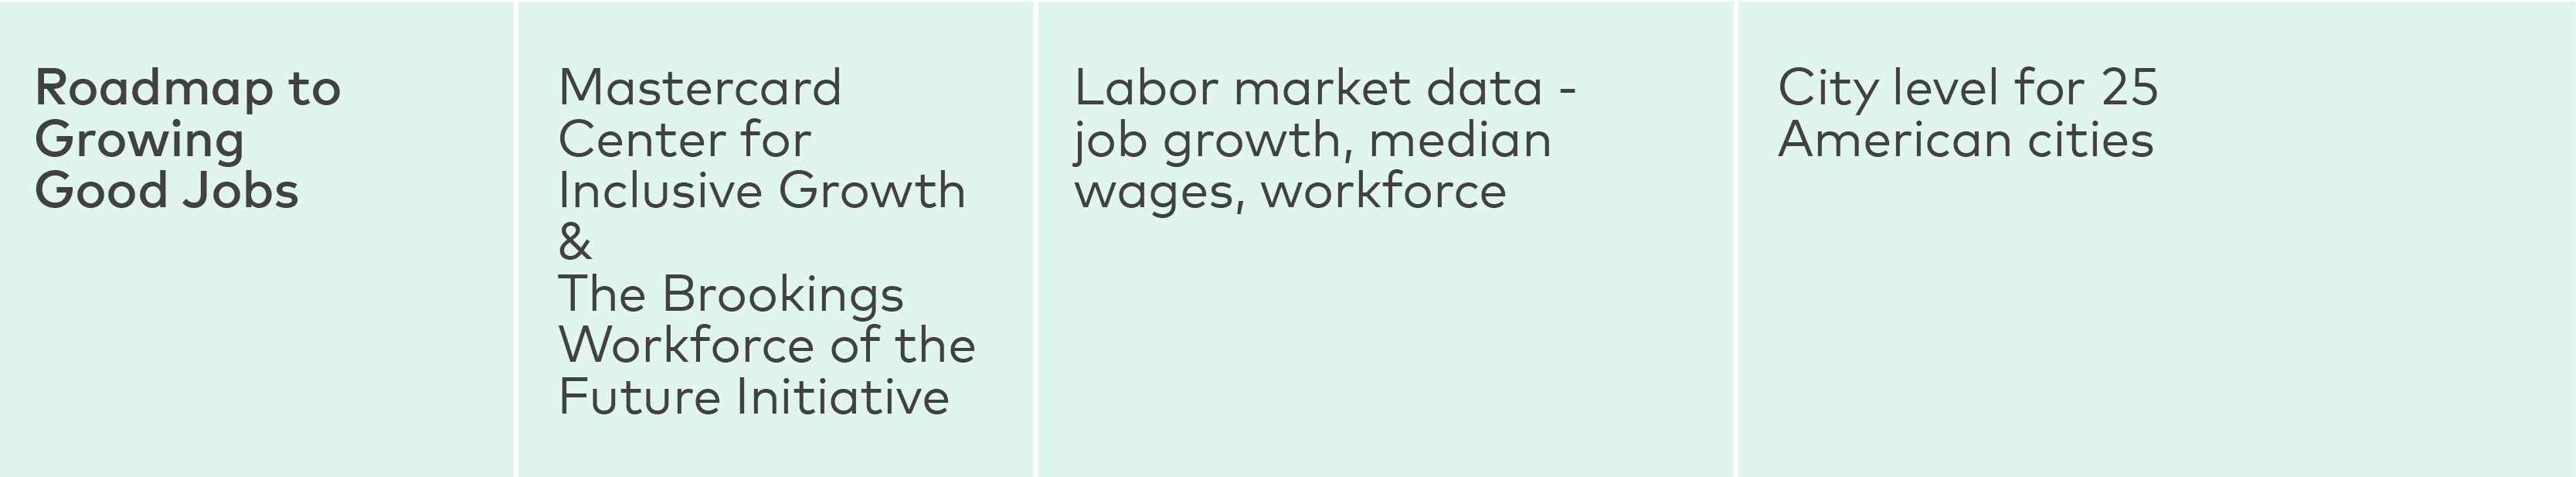
Introduce other teams to relevant data tools, such as Visualizing Vulnerable Jobs and Roadmap to Growing Good Jobs to the workforce development team, and Smart Growth Strategies to the Business Recruitment, Expansion, and Retention team.
Focus revitalization efforts by using results from the citywide disparity study and the Inclusive Growth Score to identify census tracts where there are strong areas of inequity that align with Birmingham’s Geographic Priority Areas.
Develop a multi-discipline team including members from other departments within the city, community leaders, and ecosystem partners to develop a plan to use the data collected around inequities and inequalities that impact all stakeholders within the City of Birmingham.
Problem statement
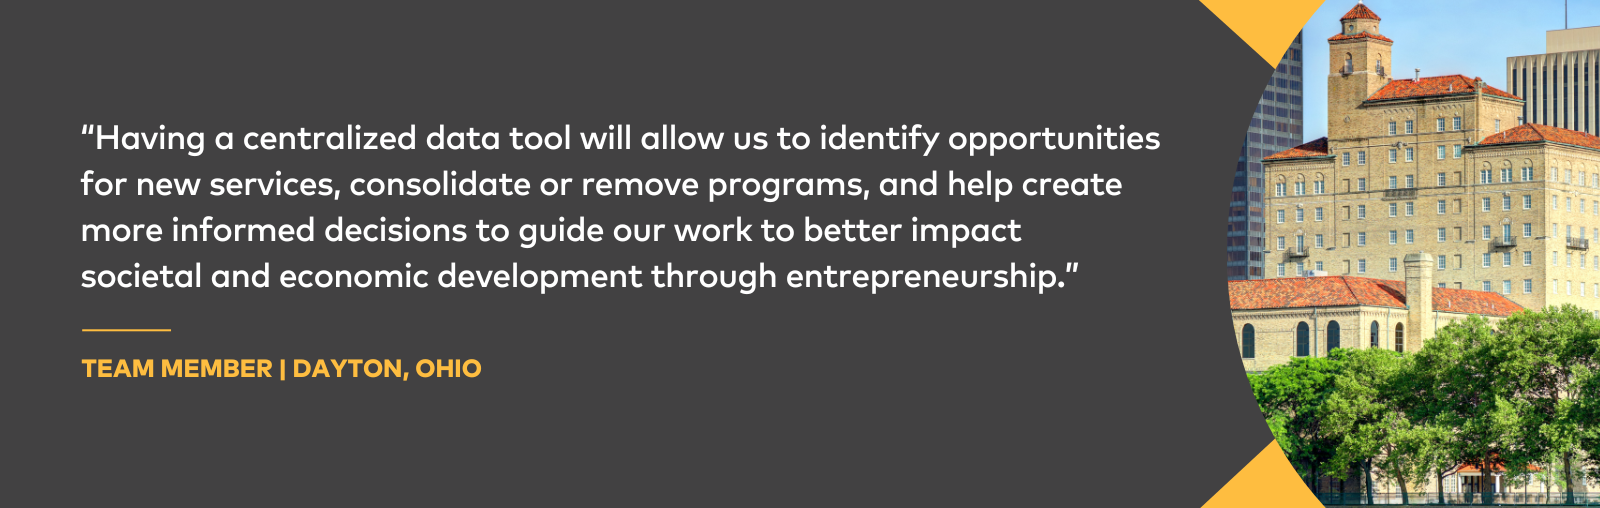
Through Data for Equity, Dayton will create a standardized process to collect and analyze data from services providers, enabling the City to tell the story of its business ecosystem and influence data-driven decision-making on programming, funding, and business support.
Background
Dayton, Ohio’s government and residents are exploring ways to improve access to economic opportunities and community resources that ensure a high quality of life for all. The city has focused on evaluating and building up the “ecosystem” of resources and services, and improving opportunities for underserved residents to start their own businesses within that ecosystem.
In 2021, the City of Dayton released the Dayton Inclusive Recovery Plan, which outlined ARPA funding allocations to invest in “long-term transformational and sustainable” resources, such as business micro-grants and neighborhood improvements for communities that were disproportionately impacted by the Covid-19 pandemic due to existing socioeconomic, health, and racial disparities.
Dayton’s Data for Equity team members were all involved in developing the forthcoming Inclusive Business Recovery Opportunity Center (IBROC). Formed to support the implementation of the Recovery Plan, IBROC aims to become an operational initiative designed to “support the ecosystem that assists black and brown entrepreneurs with the resources and connections needed to support their development and growth.” The team recognized that if used effectively, a cohesive approach to data collection and assessment could support storytelling about the city’s business ecosystem and inform decision-making on programming and funding to support businesses.
Dayton’s team included the Deputy City Manager and other staff from the City Manager’s Office and the Department of Economic Development, as well as leaders from the Urban League of Greater Southwestern Ohio, Greater West Dayton Incubator, and Launch Dayton.
Challenges and ideas
While most Data for Equity teams were entirely or mostly made up of public sector employees, Dayton’s team included representatives from the nonprofit, university, business, and public sectors. They focused on how tools and other learnings could inform an IBROC strategy and business plan that includes data models, ecosystem assessments, and goal-setting based on Dayton’s Inclusive Recovery Plan.
Over the course of the program, team members explored how Dayton’s context both resembled and differed from other cities facing similar challenges. They also stressed the importance of an opportunity-focused approach to economic development rather than a heavy focus on problems or deficits facing communities.
Dayton’s team emphasized the interconnectedness between services and systems and how cohesive evaluation structures can enhance that ecosystem. They were interested in how to build a centralized data reporting and evaluation structure, which would allow them to “identify opportunities for new services, consolidate or remove programs, and help create more informed decisions to guide [their] work.“ This approach was informative for other Data for Equity participants.
Tools
Dayton’s team intended to utilize data tools that inform a specific aspect of IBROC’s strategic business plan development. They focused on tools that can help identify neighborhoods to prioritize when allocating resources, determine appropriate programming that will match the needs of business owners and entrepreneurs, and monitor long-term financial stability and community wealth to inform program evaluation.
Inclusive Growth Score, Center for Inclusive Growth
Smart Growth Strategies, Brookings
Financial Health and Wealth Dashboard, Urban Institute
Next steps
The Dayton Data for Equity team identified tools to incorporate into the City of Dayton’s plan to contract with a consultant to develop a strategic business plan and an implementation plan for IBROC, including:
Inclusive Growth Score - Inform how opportunities for advancement and revitalization are prioritized by tracking the progression of inclusiveness and access to resources in key neighborhoods. Use of this data will also inform benchmarking with other Ohio cities.
Smart Growth Strategy - Help ecosystem partners determine appropriate programming to match the needs of entrepreneurs from high-demand industries and inform understanding of development and growth needs of local industries.
Financial Health and Wealth Dashboard - Support long-term evaluation of IBROC’s impact on targeted business owners’ opportunities and profitability.
Problem statement
Through Data for Equity, Louisville will identify key data to improve services for Black residents with the ultimate goal of recommending methods to rectify the vestiges of discrimination caused by “redlining” Historically Black Neighborhoods.
Background
Louisville, Kentucky’s Data for Equity team possessed a strong understanding of how institutional biases and structural racism, especially the ongoing legacy of redlining, impact residents’ lived experiences and economic opportunities. The team was interested in learning more effective tools to identify opportunity and wealth gaps for residents of predominantly Black neighborhoods like West Louisville, in order to inform efforts to address these inequities.
Louisville’s government structure was unique in this cohort; since 2003 the city and county have had a consolidated government with coterminous borders, known as Louisville Metro. In 2020, Louisville Metro launched the Build Back Better, Together Initiative, which aimed to “increase Louisville’s long-term resiliency” by both taking immediate steps to support residents and businesses impacted by the Covid-19 pandemic, and making systemic changes over time to address equity and racial justice. The initiative brought together cross-sector teams, including residents, to examine and make recommendations for equity challenges in education, health and safety, the economy, arts and culture, and other areas.
Louisville’s Metro Council enacted an Equity Ordinance in 2021. The Ordinance required all city departments to identify goals, action steps, and key performance indicators to achieve equity in their operations and services on a yearly basis.
Louisville participated in Data for Equity in the lead-up to a significant transition. A new mayor took office near the conclusion of the program, accompanied by a new Executive Director of the Office of Equity and significant restructuring of leadership roles. While these changes impacted the team’s immediate priorities and workloads, incoming equity leaders were enthusiastic to deepen and expand the city’s racial equity work by incorporating relevant data resources.
Louisville’s team included the Chief Equity Officer, Chief of Civic Innovation and Technology, and Director of Innovation, as well as staff from the Department of Economic Development.
Challenges and ideas
Louisville Metro had been implementing robust data collection and analysis across departments for several years, so many participants were familiar with the tools and concepts presented in the Data for Equity curriculum. However, with ongoing changes to staffing and departmental procedures, participants noted that these data tools will be helpful to maintaining an institutional understanding of how data can inform and enhance equity work.
Louisville’s participation in this cohort was informative for many peers in other cities, as they already had a robust internal data system and established processes for improving racial equity across departments. Atlanta’s team noted that Louisville’s Equity Ordinance provided useful information on how their own city government could approach developing an ongoing, citywide equity assessment.
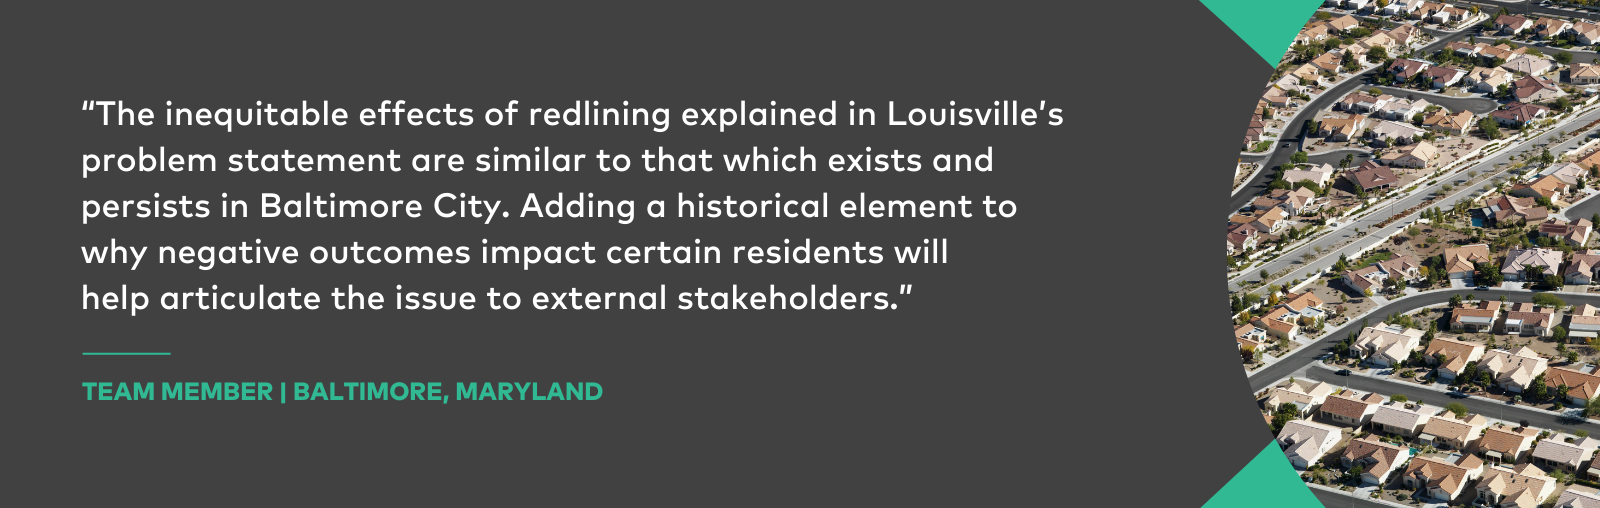
Other teams appreciated that Louisville’s approach highlighted the seriousness of understanding the long-term impact that policy decisions can have on residents. Baltimore’s team remarked that including historical reasons for current challenges will help them articulate equity challenges and solutions to external stakeholders.
The Salt Lake City team shared that Louisville’s team demonstrated how data and an understanding of history together could inform current proposals. The Louisville team described finding data about predominantly Black neighborhoods that had been impacted by redlining to support an ordinance that would allocate remaining ARPA funds to these neighborhoods.
In turn, Louisville’s team remarked on the importance of having different government departments represented in the cohort, as diverse perspectives and specializations significantly enhanced their experience.
Tools
Louisville Metro’s Office of Equity considered addressing income inequality between Black and white residents to be a high priority, and recognized that homeownership plays a major role. The tools that were most useful to this work allowed them to delve more deeply into economic disparities, access and barriers to homeownership, and the broader context of social determinants of health. They also emphasized the importance of tools like the Black Progress Index, which go beyond presenting data to sharing actionable insights.
Inclusive Growth Score, Center for Inclusive Growth
Black Progress Index, Brookings Metro
Next steps
Capacity and workload challenges during the mayoral transition made it difficult for the Louisville Data for Equity team to delineate specific plans for their next steps. However, the team knew they wanted to share what they learned and discussed with incoming leadership. They also recommended inviting Dr. Andre Perry from Brookings Metro to give a custom presentation to city leaders about the Black Progress Index in Louisville and how it could inform Louisville Metro’s equity work across departments.
Incoming staff expressed excitement about the promise of bringing more data into existing equity initiatives, especially regarding housing affordability and homelessness prevention, in order to make that work as robust and well-informed as possible.
Problem statement
Through Data for Equity, Salt Lake City will use data to identify major languages spoken in the city, understand how it can better support economic growth for non-English speaking communities, and make policy recommendations that break down barriers to resources and opportunities.
Background
Salt Lake City’s approach was unique in the Data for Equity cohort. By focusing specifically on language access, they highlighted the importance of considering a range of factors that might impact residents’ access to resources and opportunities. They also noted that tools with details about broader contexts can be especially useful to interdepartmental equity efforts.
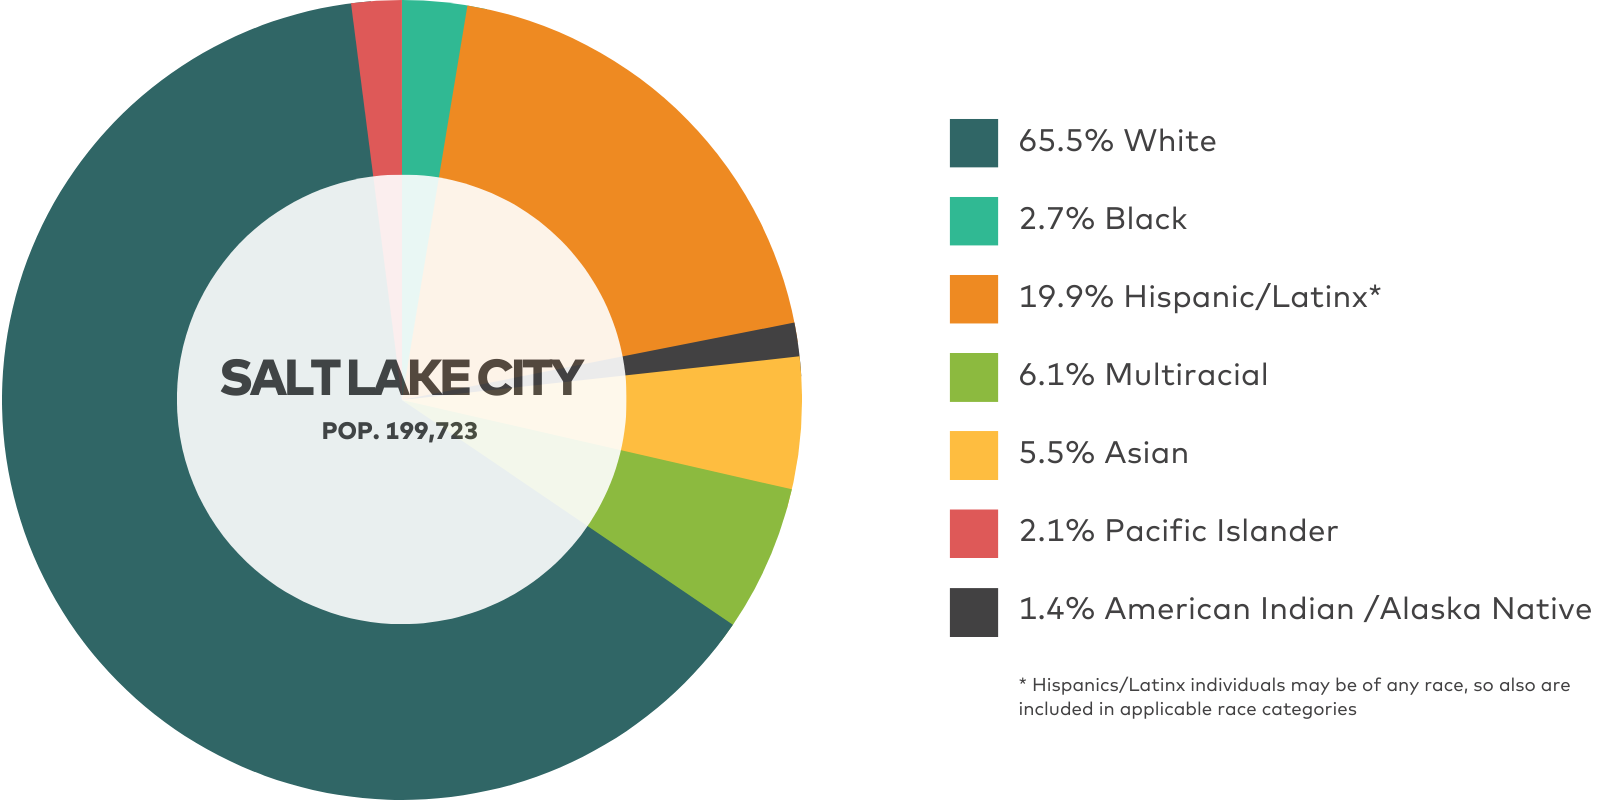
The westernmost and youngest city in the Data for Equity cohort, many of Salt Lake City’s historical and systemic equity challenges were based in somewhat different historical circumstances. Salt Lake City’s early economic expansion did not attract Black residents to the same extent as East Coast and Midwestern cities. Nevertheless, discriminatory practices like redlining created racial and economic dividing lines that persist today.
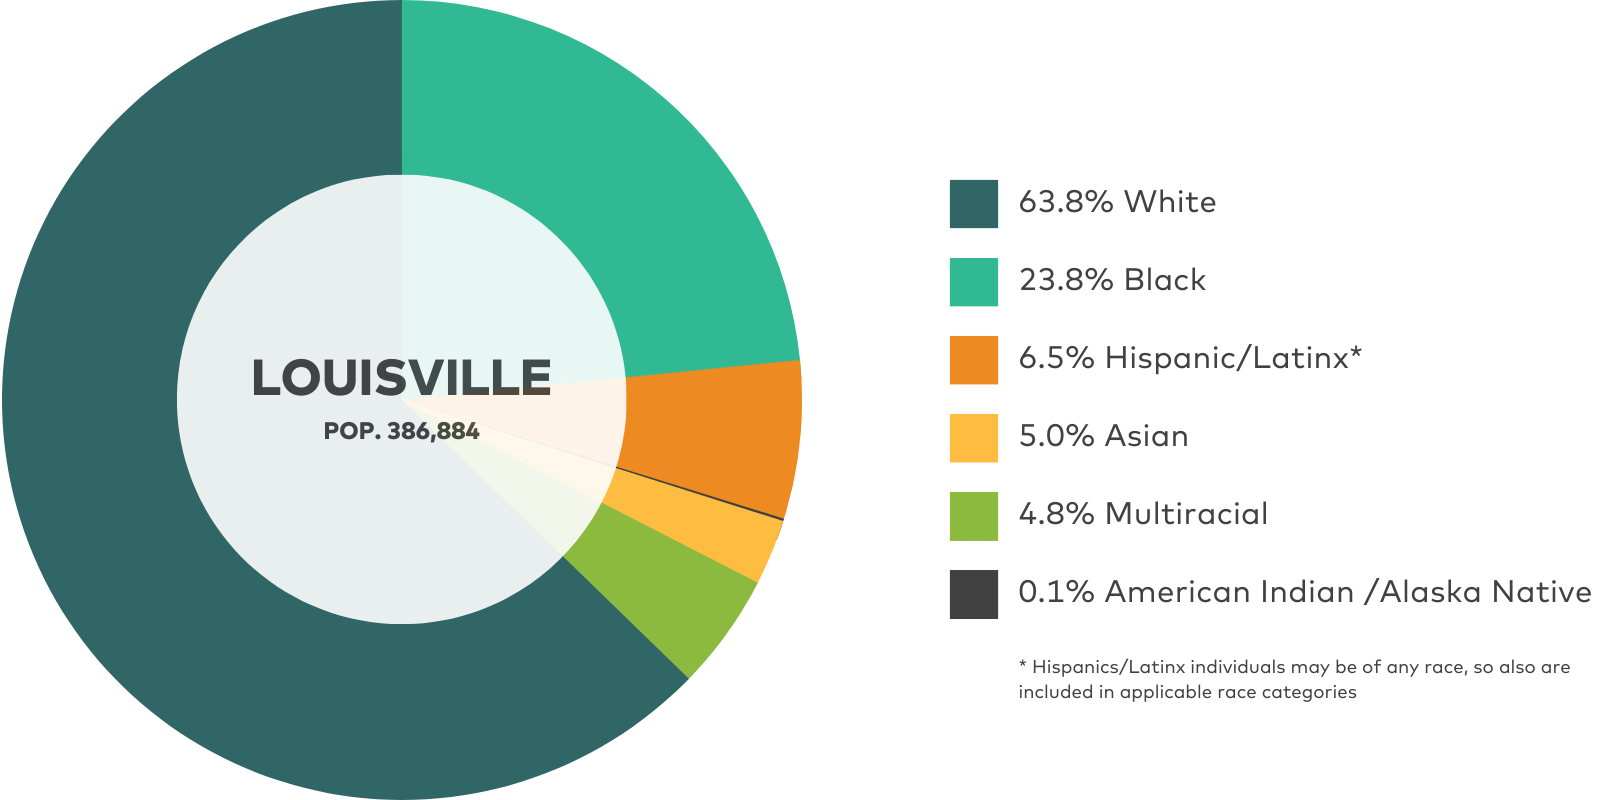
Salt Lake City’s population has become increasingly diverse, with the foreign-born, Hispanic/Latinx, and Asian & Pacific Islander communities growing significantly. According to the US Census Bureau, people who were born outside of the United States make up about 16% of the population and almost one in four residents speak a language other than English at home. The city’s rapid growth in recent decades offers both opportunities and challenges to ensure city systems become more inclusive and equitable.
The Data for Equity team knew that language access was a significant economic and racial equity issue for their city. While some city services could help close racial and economic disparities, English-only outreach would leave out significant portions of the population. Participants noted that as the city grows and changes, proactive and adaptive efforts to create a truly inclusive and equitable economy are essential.
Starting in 2020, the Mayor’s office began releasing annual city plans outlining goals to improve racial equity and accessibility in services. Goals included creating processes to incorporate geographic and social equity into the Department of Economic Development’s policy agenda and strategic plan “in perpetuity,” and the development and integration of a citywide equity plan.
The 2022 plan included refining and finalizing the city’s Language Access Plan, translating priority documents, and identifying the best ways to improve language access for different services and resources.
While the city government serves many residents whose primary language is not English, participants said they did not yet have city-level data on how these residents participate in the local economy or where specific barriers exist. In addition to helping identify and address barriers to resources, collecting this data could improve general service outreach and engagement with important parts of the Salt Lake City community.
Salt Lake City’s team included the city’s Chief Equity Officer, Chief Data Officer, Chief Information Officer, and Equity Liaison, as well as staff from the Mayor’s Office, Housing Stability Division, and Department of Economic Development.
Challenges and ideas
Salt Lake City’s approach was unique in the cohort and yielded important insights about aspects of equity and inclusion that are sometimes neglected. Conversations they prompted about language access allowed participants from several cities to share about language access initiatives and programs in their respective cities, including challenges, lessons learned, and innovations. This also connected broader considerations about what it means to be inclusive of different communities.
Salt Lake’s team noted that an important aspect of improving accessibility for underserved communities was understanding why residents may not respond to outreach or utilize services. While language use is part of this equation, they highlighted that direct engagement with the community is necessary to understand the full picture.
Tools
Salt Lake City’s Data for Equity team highlighted tools that include key equity information for their needs, including data on language use, census response rates, quality of life, and environmental conditions.
In addition to providing key language access and economic inclusion data, participants said that tools that provide data about broader contexts can be especially useful when collaborating with other departments. Some of these tools also offer guidance on strategies based on different scenarios and user priorities.
Response Outreach Area Mapper (ROAM), US Census Bureau
Inclusive Growth Score, Center for Inclusive Growth
Smart Growth Strategies, Brookings
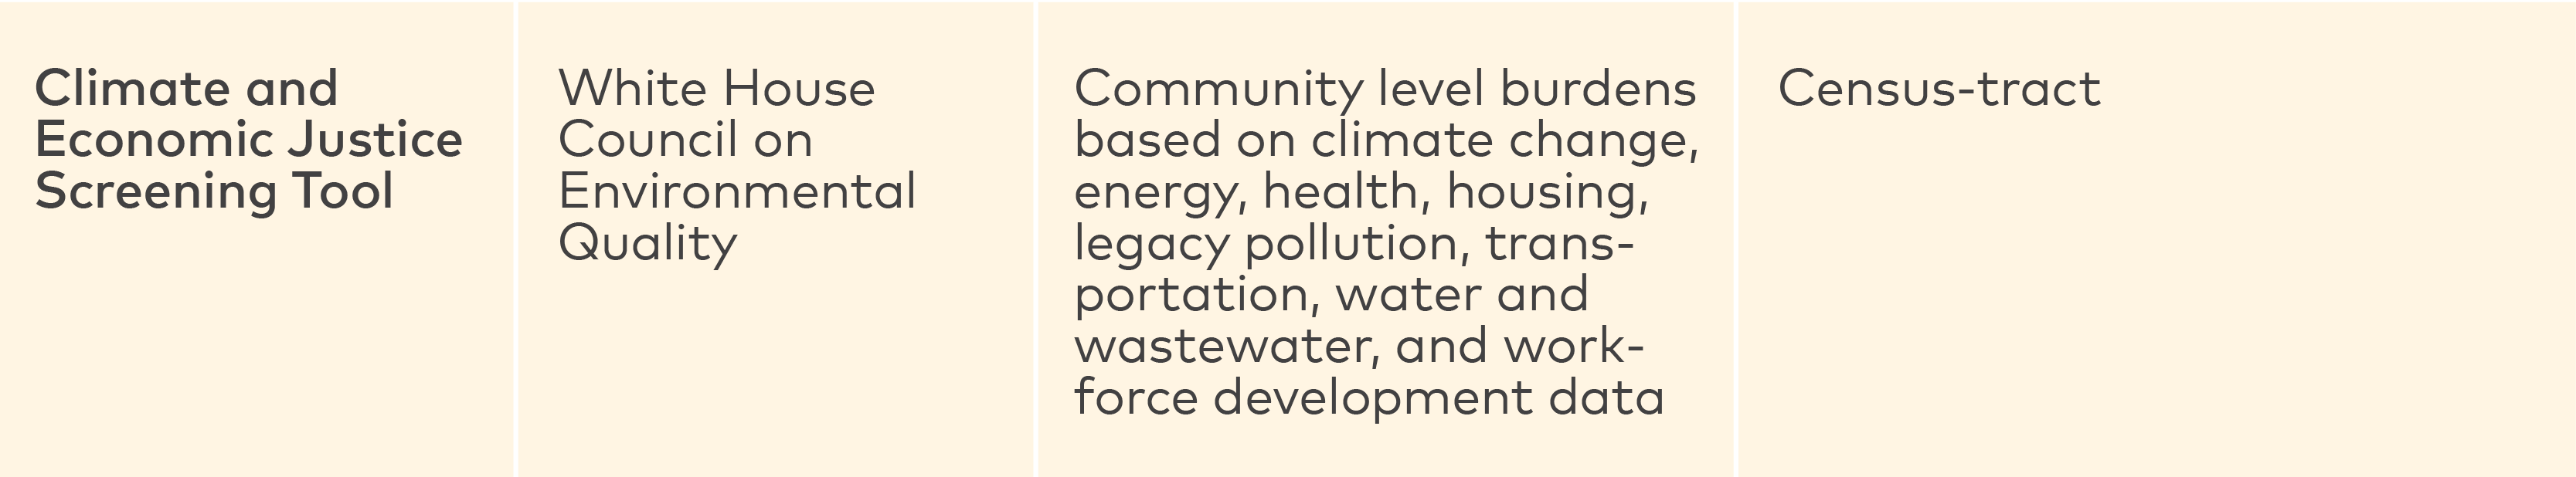
Climate and Economic Justice Screen Tool, White House Council on Environmental Quality
Next steps
This team outlined several ideas to share data tools with their own and other departments and to make recommendations for how those departments can make data-informed decisions. These plans included:
Share relevant data tools with the economic development team and the city council.
Use learnings and tools to make recommendations to decision-makers in the Mayor’s Office of Equity and Inclusion, facilitated by a team member who works on policy for new Americans and refugees. These recommendations would focus on ensuring that effective data collection is a priority, as well as using data to substantiate the need for and importance of the language access policy.
Use data tools to identify areas to improve language accessibility and outreach for key economic resources such as resident grants and affordable housing programs.
Use data tools to add more layers of data to an existing language database for the Salt Lake School District, and make the database available to city staff who are working on a range of projects that affect those communities.
Beyond language access
While the team focused on improving equity through language access, they recognized that Data for Equity tools and themes would be helpful in other equity assessments across the city. For example, the team noted that some data tools could inform and bolster city and residents’ concerns about the potential environmental and economic impacts of a proposed freeway expansion.
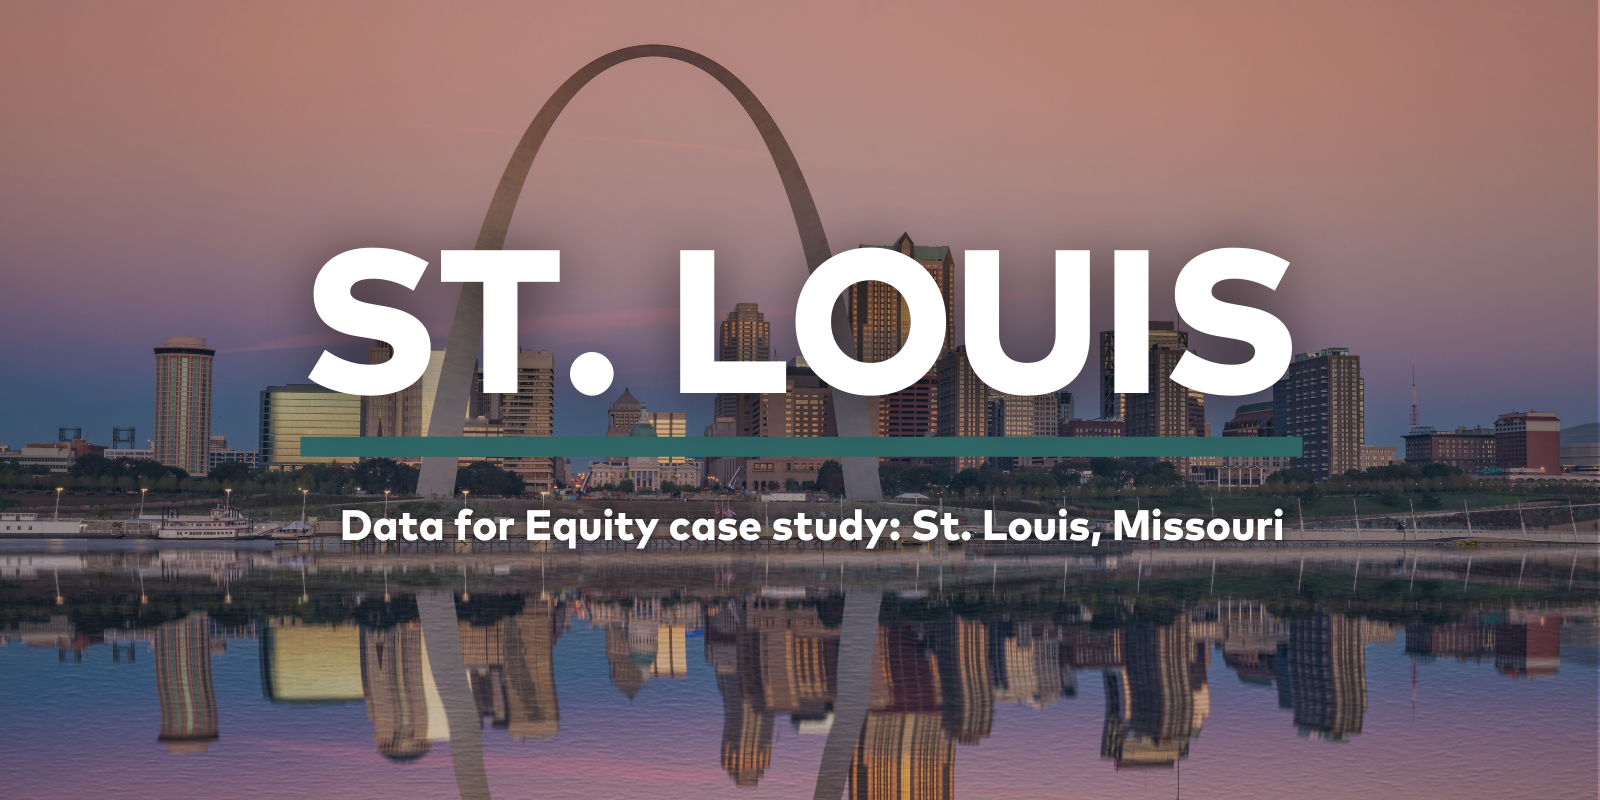
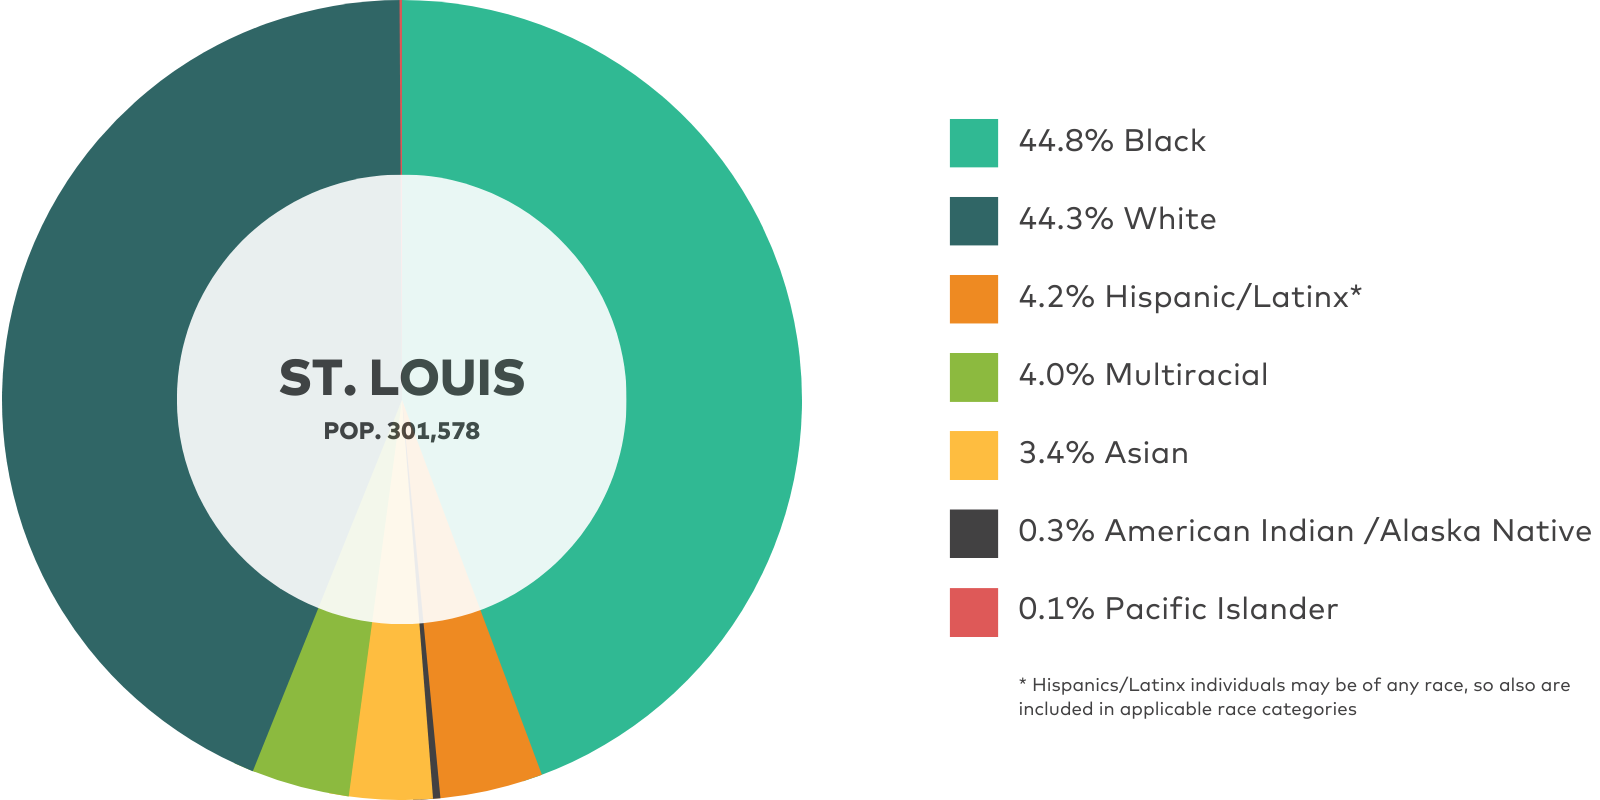
Problem statement
Through Data for Equity, the City of St. Louis will refine, improve, and expand outcome measures for Economic Justice Action Plan (EJAP) and ARPA funded programs to ensure they are driving equitable outcomes and providing the requisite data for analysis and improvement.
Background
The St. Louis, Missouri Data for Equity team knew that federal rescue and recovery funds provided an unprecedented opportunity to bolster the city’s efforts to ensure that new economic development would serve the needs of historically underserved and marginalized communities. They also understood the importance of ensuring that these investments were well-informed and accountable to communities, and that being able to show effective and responsible use of ARPA funds could yield additional funding from various sources in the future.
Alongside city officials, St. Louis' team included representatives from the nonprofit sector engaged in public-private partnerships to improve residents’ economic opportunities and well-being. The St. Louis Development Corporation (SLDC) is a nonprofit established in 1989 by state statute to support the city government’s economic development work. The SLDC uses an Equitable Economic Development Framework, based on several forms of community engagement, which establishes a vision and goals to improve economic opportunities for all communities in the city.
In 2022, the St. Louis mayor and the SLDC released their Economic Justice Action Plan (EJAP), also known as the Roadmap to Economic Justice. The EJAP was based on three “strategic pillars”: economic empowerment, neighborhood transformation, and equitable and inclusive development. The EJAP outlined plans to use ARPA, other public grants, private revenue and philanthropic contributions to invest in programs such as a small business and nonprofit revolving loan fund, neighborhood capacity-building programs, and a citywide housing development fund.

St. Louis’ Data for Equity team included the mayor’s Chief of Staff, Chief Equity and Inclusion Officer, and Chief Technology Officer, as well as data and research staff from agencies including the Planning & Urban Design Agency and St. Louis Development Corporation
Challenges and ideas
Having based their problem statement on a specific action plan with predefined target outcomes, St. Louis’ team focused on how to use data tools and frameworks to provide important context for the programs themselves, and improve how they measured and understood program outputs and outcomes.
One insight they gained from conversations with other cities, particularly Dayton and Birmingham, was the value of identifying ways to gather standardized data across programs in order to have a cohesive overview of a vast array of programs.
They also recognized that while data can be useful, knowing how to tell a story with available data is important for it to be effective. They were also interested in how data experts and policymakers could work together to create more effective solutions to equity challenges.
Tools
The St. Louis team highlighted tools that provided either extensive data on a specific focus area of the city’s ARPA Recovery Plan or Economic Justice Action Plan, or that included data across a wide range of ARPA-funded and EJAP programs. In particular, they highlighted three tools that provide this information:
Inclusive Growth Score, Center for Inclusive Growth
Financial Health & Wealth Dashboard, Urban Institute
Response Outreach Area Mapper (ROAM), US Census Bureau
Other tools they intended to use going forward included:
Mobility Pathways and Smart Growth Strategies, Brookings
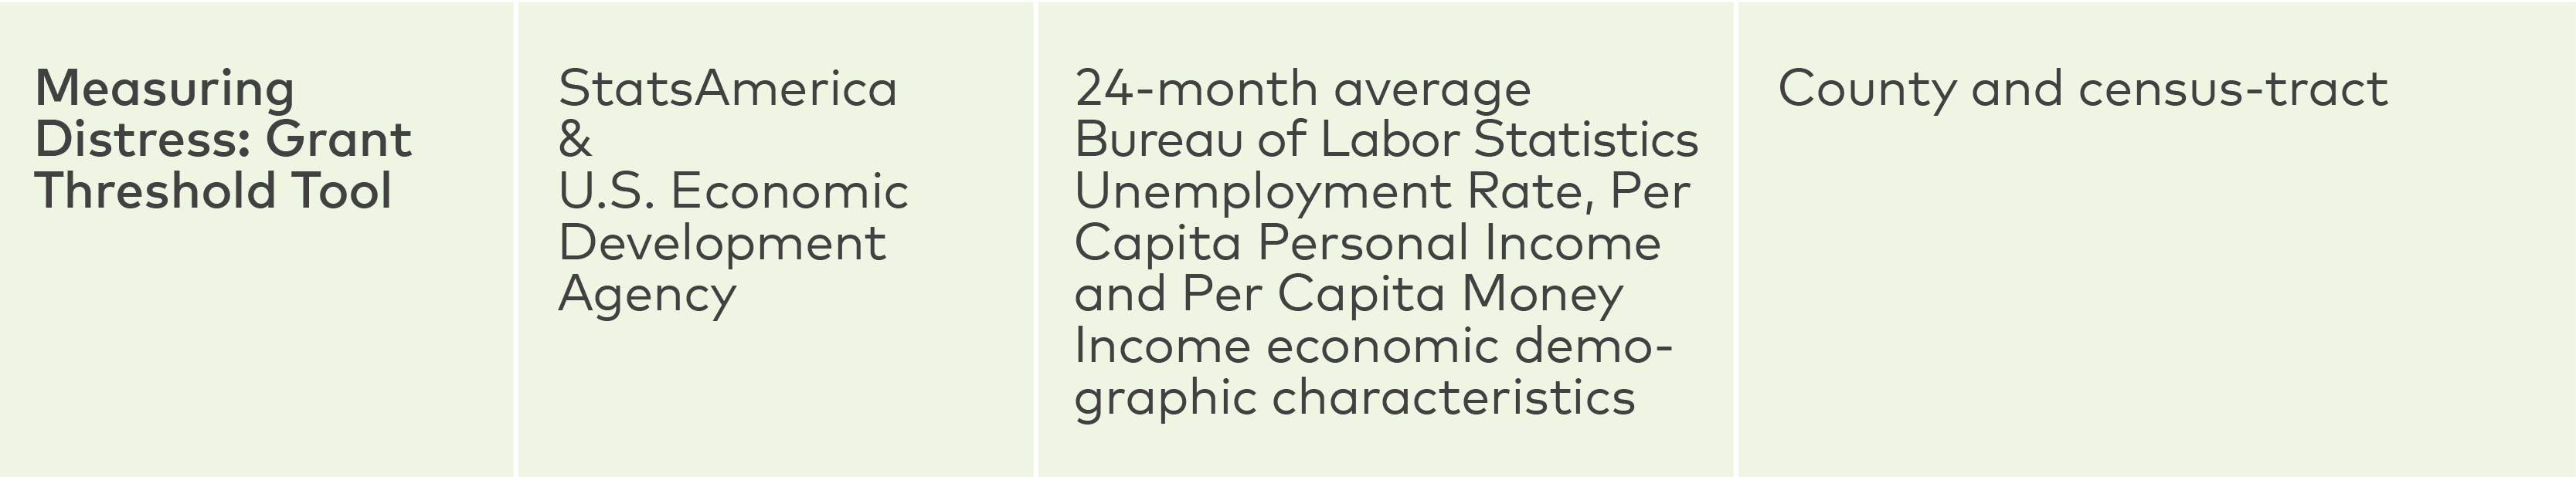
Measuring Distress Grant Threshold Tool, StatsAmerica, U.S. Economic Development Agency
Stellarsight STARs Strategy Dashboard, Opportunity@Work
Next steps
To ensure that what they learned would be easily accessible to colleagues and other stakeholders, the St. Louis team started building a city-specific toolkit connecting data tools to relevant Economic Justice Action Plan and ARPA-funded programs. Their plans to build and apply the toolkit included:
Identify new opportunities to incorporate data tools across city programs and add them to the toolkit.
Build out an “Interactions with Programmatic Output/Outcome Tracking” section identifying data points and tools that were directly relevant to outputs and outcomes for Recovery Fund programs Economic Justice Action Plan initiatives.
Make the toolkit persistently available for economic development staff and other stakeholders working on relevant equity projects.
In addition, before the program concluded the team shared that they were working with a community development administrator to integrate learnings from the Inclusive Growth Score into an existing effort to inform the program’s priorities.
Tampa, Florida’s city diversity and equity efforts are relatively small, but no less enthusiastic. The Tampa Administrator of Neighborhood Affairs also serves as the Chief Diversity Officer for the city. Tampa’s one Data for Equity participant was the Diversity Coordinator, who joined the program as an observer. While she did not complete a full case study, she shared a few key insights.
As an individual coming from a very small department, she recognized the benefits of bringing a team from different offices to a program like Data for Equity. Representatives from different departments and roles brought important perspectives to discussions, and she observed that it would also make it easier to integrate learnings into city offices.
She also spoke to the challenges of being in a small department whose work applies to multiple facets of city government when those departments have not incorporated equity lenses into their work. As interdepartmental coordinators for diversity efforts, she and her colleagues examined equity and diversity needs in housing, workforce development, health, and education.
Being able to join conversations with Data for Equity peers via the cohort Slack channel allowed the Tampa participant to interact more with other teams and get ideas for how larger groups could collaborate on equity efforts. For example, she met with the Atlanta team to learn how they were using one of the course tools and intended to stay in contact with them following the program.
As an individual representing a fairly new department, the Tampa participant had a great deal of responsibility to share what she learned in cohort meetings with her colleagues. However, she had already begun sharing what she learned, not only with her own diversity and equity team, but also in the city’s housing and workforce development efforts.
When first connecting with cohort members, a significant overlap in cities’ approach to equity became apparent. While each city is at a different point in their data and equity journeys, there were several commonalities across all cities, including, but not limited to:
Plans to further develop Diversity, Equity, and Inclusion initiatives
Interest in exploring ways federal and other funding sources can be allocated toward equity work
Desire to catalyze inclusive economic development initiatives in historically marginalized communities
Interest in improving workforce opportunities for historically marginalized communities
Data for Equity sought to build upon these commonalities so that cities could work together to foster economic equity.
At the conclusion of the cohort in December 2022, CPI identified key learnings gathered in sessions throughout the program, from survey responses provided by participants on a biweekly basis, and from the learning memos each participating city team completed in January 2023. Our takeaways from the first Data for Equity cohort are listed below:
Cities responded very positively to tools that explicitly dealt with racial equity, such as the Black Progress Index or Financial Health and Wealth dashboard. Unfortunately, there are not as many tools currently available beyond those previously mentioned that robustly segment data by race, which left many participants with a desire to explore the issue further while lacking the tools to do so thoroughly. More complex cuts of data, which take race, gender, etc. into account, could also help participants better address underinvestment of marginalized groups in their communities. Future Data for Equity programming should seek to build a more comprehensive module on racial equity within its curriculum.
Team member - Atlanta, Georgia“Dr. Perry's entire presentation [on life expectancy for Black Americans] was an eye opener for me and I plan to delve deeper.”
Participants shared learnings, ideas, and challenges with each other and applied insights from other cities to their own work. This element of the program was so popular, in fact, that several participants expressed that they would have liked even more time to speak with each other inside and outside of cohort classes. This horizontal learning approach would be taken into account in any future designs of the Data for Equity program.
Team member - Dayton, Ohio“Learning from other municipalities and our peers of their projects and efforts was one of the best learning tools in the program.”
Participants used the Data for Equity program as a dedicated space to bring together personnel from multiple departments and other city stakeholders to advance existing equity work. Many problem statements referenced specific ongoing initiatives in their cities to support DEI efforts, like equity action plans, committees, and equity audits.
Team member - St. Louis, Missouri“I like the tools because we can apply [them] to our Economic Justice Action Plan, which was recently launched in St. Louis.”
Using tools with both high-level (e.g., by metro service area) and more detailed views (e.g., data broken down by census tract) allowed cities to compare neighborhood performance to that of the city as a whole. City participants wanted to make targeted changes at the neighborhood level, and liked the flexibility of tools like the Inclusive Growth Score that show data in a granular manner.
Team member - Dayton, Ohio“I like how you can drill down into the counties [for this tool] and even see additional data for the metrics you select.”
Many participants responded to Data for Equity’s emphasis on using engagement with residents as qualitative data to supplement quantitative data from data tools. Participants valued hearing best practices and strategies for collecting community input on city issues, or on the distribution of federal funds.
Team member - Atlanta, Georgia“I learned from Dr. Gehl about the ARPA toolkit and using it as a mechanism to enhance community engagement to discern how the resources can/should be allocated.”
Participants noted that tools such as Brookings’ Smart Growth Strategies and a presentation from Accelerator for America about specific funding and development strategies helped diagnose equity challenges in their community, and motivated them to take action. Participants expressed interest in receiving additional guidance on how equity action plan development and implementation, as well as help in identifying opportunities for growth.
Team member - Louisville, Kentucky“I found the resources shared during AFA's presentation really helpful. Our loan program is currently doing research on equitable practices in lending/collateral, and I'm eager to explore the case studies.”
Data tool developers from the Brookings Institution, Urban Institute, etc. shared that they do not have many opportunities to demonstrate their tools in real time or to hear directly from end users like city government officials. This program helped bridge the gap between creator and user, and allowed developers to hear feedback from the intended audience.
As the Data for Equity program carries forward the learnings and insights gathered in the first cohort, there are three key points to consider as programmatic next steps.
The first Data for Equity cohort brought together participants from many different departments within city governments, but almost all cities selected their Chief Equity Officer (or equivalent) to serve as leaders on their teams. Further, several cohort participants expressed that, as Chief Equity Officers, they often felt like they were operating on an island within government. We believe there is a unique opportunity to build upon the small Chief Equity Officer network the cohort established and expand it to Chief Equity Officers across the country.
A Community of Practice (CoP), for example, could support leaders in the relatively new field of Equity Offices to forge connections across cities, encourage the exchange of best practices, and develop their strategic capabilities (similar to Bloomberg Philanthropies’ work with Chief Innovation Officers, the Rockefeller Foundation’s work with Chief Resilience Officers, and the Knight Foundation’s work with Chief Data Officers). A CoP could also explore how Chief Equity Officers can earn buy-in from senior city leadership and funding opportunities for projects, and better engage community organizations and residents. The CoP could also serve as a monitoring tool to assess how long-term changes in institutional mindsets around equity in cities change over time.
As noted in the Key takeaway section above, cities were pleased to discover how data tools helped them diagnose existing equity disparities within their communities — the ‘what.’ Many participants, however, expressed an interest in learning how they can implement solutions to address those disparities — the ‘how.’
Data for Equity could explore more ways to customize content and workshops for cities, helping them investigate new approaches to racial equity and inclusive economic and workforce development initiatives. Cities could also receive individualized guidance from the program on how to use the tools and frameworks in their local context.
The first Data for Equity cohort primarily featured data tool creators and experts to instruct participants on how to use their tools to identify equity challenges within their communities. The cohort also heard from a few other non-tool experts in classes, who focused more on case studies and equity best practices.
Several program participants shared that they would have liked to hear from other kinds of experts. For example, the program should explore including more non-traditional data leaders, like community activists, organizers, and residents themselves, who can accompany the quantitative insights gathered from the tools with their qualitative expertise. Additionally, the program should seek to include even more case studies, to better illustrate to cities how others have applied data insights to equity work. The more practical examples of data use, the better.
The first Data for Equity cohort successfully brought together civil servants from eight metropolitan centers across the US to learn how to apply data tools to improve equity standards in their communities. Participants learned from some of the foremost experts in data tools and analysis from renowned organizations like the Brookings Institution, Urban Institute, Accelerator for America, Opportunity@Work, the Roosevelt Institute, and more.
Participants learned how to apply data tools to better diagnose equity issues within their cities, the importance of pairing qualitative and quantitative data in understanding a problem, and learned about the challenges and actions taken by their peers in addressing equity. The Data for Equity program was a productive step forward that our cities took in their wider data and equity journeys, but there is a lot of work to be done in the years ahead.
The importance of evaluating data from the perspective of an equity lens was perhaps best illustrated by one of our cohort participants when describing their fresh understanding of life expectancy data, as demonstrated by Dr. Andre Perry’s Black Progress Index.
Data can hide issues, or it can illuminate them. That is why breaking down big data from the perspective of equity is so critical. While life expectancy may be increasing for Americans overall, an equity-focused tool like the Black Progress Index showed how that is not a universal experience, particularly in Black communities and other historically marginalized and underserved communities. We hope Data for Equity can encourage more cities to use both data and equity together when tackling urban equity challenges.
CFIG and the Centre for Public Impact are committed to helping public servants work toward solutions to equity disparities in our communities and are excited to share our insights with city governments across the nation.
A wide range of new “big data” has recently become available to local policymakers, covering everything from local childcare prices, to local job postings, to the impact of neighborhoods on children’s adult outcomes. This new information will invariably improve our understanding of the sources of inequity and inequality at the local level and, as a result, will help policymakers address them. For instance, the data are already helping local officials uncover barriers to upward economic mobility, improve the targeting of policies to those most likely to benefit from them, and improve program evaluation to understand what works and what does not. However, the power of these new datasets does not come without tradeoffs. Their strength is that they typically provide high frequency, highly localized information. But these features can also make the datasets unwieldy, and it can be difficult for local officials with limited resources to extract and apply the insights.
What is needed are easy-to-use tools that make this vast information available to local policymakers in ways that support, rather than complicate, their decision making. The Data for Equity program has set out to achieve this, and our Brookings Workforce of the Future initiative has been proud to play a part in moving the project forward. The Data for Equity model fills a critical gap along the path to widespread, productive use of big data by matching the researchers and developers who produce policy tools to the practitioners who will use them. This begins an iterative process of user feedback and tool development that mimics the market testing that is common and essential to private sector product development—a process that will become even more critical as policymakers become increasingly invested in data as a guide for decision making.
We introduced our Smart Growth Strategies tool to the practitioner community through the Data for Equity program. This tool allows cities and Economic Development Districts to explore economic development strategies that draw from their local comparative advantages and chart a workforce strategy to execute those strategies. Importantly, the practitioner cohort that we encountered included a diverse set of cities with unique backgrounds, economies, and priorities for achieving equity in their communities. This challenged us to think more deeply about how we can improve and extend our tool to meet their varying needs. While our team has deep research and data experience, we were usefully humbled by the real-world feedback we received from those who will use our tools.
The Data for Equity program has been essential to our tool development process and, most importantly, has increased the value of our Smart Growth Strategies tool to policymakers. But beyond that, the program sets out a new and effective model for harnessing big data to promote more equitable communities.
Sincerely,
Gregory Wright, PhD
Brookings Institution
Data for Equity introduced local governments and public servants to data tools that can help inform policies related to creating an inclusive economy, particularly for Black and other communities of color. A broad variety of tools were presented during the cohort, ranging in focus from resident financial health to city workforce development to the distribution of ARPA funds.
Our Data Tool Playbook features data tools from the cohort that can be used by other local governments and public servants. It aims to provide the information needed to increase inclusive and equitable growth in their economies. The tools listed in this section reference different components of the economy and identify areas of growth, and/or provide pathways for growth.
The Data Tool Playbook is divided into categories to allow public servants to find tools most pertinent to their work:
Economic health and inclusion indicators
Workforce and job industry
ARPA and federal funding
Urban space and environmental
Personal finance
Broadband access
.png)
We are grateful to our learning partners and subject matter experts who made this program possible: our partners at the Mastercard Impact Fund, with support from CFIG, the data tool developers who shared their expertise, and cohort participants who are dedicated to advancing racial equity.
This program would not have been possible without the enthusiastic participation and input of our cohort members. We deeply appreciate the participants’ passion for racial equity, their curiosity, and their eagerness to share insights and challenges.
Atlanta, Georgia: La’Shawn Dudley, Carol Anderson, Bonika Wilson, Nonet Sykes, Tara Buckner, Sabina Kasumova, Layla Bellows, Carolyn Kovar, Anum N. Ali Mohammed
Baltimore, Maryland: Dana P. Moore, Caron Watkins, Jordan Barry, Marco Merrick, Annie Fullas, Tonya Brinkley, Nicole R. Green, Phillip Gaines
Birmingham, Alabama: Coreata' R. Houser, Rachel Buchan, Michael Shattuck, Dorothy (Dot) George
Dayton, Ohio: C. LaShea Lofton, Lamonte Hall, Jr., Veronica Morris, Utsey Shelton, B. Cato Mayberry, Whitney L. Barkley, John Owen, Belinda Matthews Stenson
Louisville, Kentucky: Grace Simrall, Michael Meeks, Eric Burnette, Andrew McKinney, Melissa Ryan
Salt Lake City, Utah: Aaron Bentley, Michelle Mooney, Cathie Rigby, Nick Kryger, Roxana Orellana, Alexander Lundy
St. Louis, Missouri: Simon Huang, Andrew Knop, Jake Narup, Jason Whiteley, Gizelle Cota, Walker Hamilton
Tampa, Florida: Rugina Castillo
Each presenter enhanced the learning journey and provided important resources to support cities’ efforts to advance equitable economic development. Thank you to everyone who shared their time and expertise.
Smita Jain and Arturo Franco, Mastercard Center for Inclusive Growth
Greg Wright, Alex Cordero and Ian Seyal, Brookings Institution
Oriya Cohen, Miranda Santillo, Mingli Zhong, and Kassandra Martinchek, Urban Institute
Sara Beth Gehl, Southern Economic Advancement Project and Roosevelt Institute
Andre Perry, Brookings Metro
Leo Garcia, National Conference of State Legislatures
Mary Ellen Wiederwohl, Rachel Reilly, Gary Walton, Jr., and Ian O’Grady, Accelerator for America
Papia Debroy, Audrey Mickahail, Georgia Gillette, and Rachel Providence, Opportunity@Work
Emmanuel Frimpong Boamah, Social Progress Imperative
We are also grateful to the many developers whose tools will further enrich cities’ efforts through our Data Tool Playbook.
Thank you to the team at the Centre for Public Impact who worked on this project: Dan Vogel, Jorge Fanjul, Lauren Hendricks, Megan Humes, James Post, Athena Hughes, Nicole Hildreth, Alejandra Montoya, Valerie Odonkor, Elysa Neumann, Hande Apaydin
Finally, we are deeply appreciative of the guidance and support from the CFIG. Mastercard’s robust set of tools, expertise in data management, and network of data equity champions, as well as CFIG’s excitement for this endeavor, were critical to its success.
Shamina Singh, Arturo Franco, Salah Goss, Rashmi Pendse, Shanna Crumley, Erica Matsumoto, Smita Jain
This report was authored by Lauren Hendricks, Athena Hughes, Alejandra Montoya, Nicole Hildreth, and Leselle Vincent.
The Centre for Public Impact is a global not-for-profit organisation founded by the Boston Consulting Group, we act as a learning partner for governments, public servants, and the diverse network of changemakers who are leading the charge to reimagine government. We work with them to hold space to collectively make sense of the complex challenges we face and drive meaningful change through learning and experimentation.
The Mastercard Center for Inclusive Growth advances equitable and sustainable economic growth and financial inclusion around the world. The Center leverages the company’s core assets and competencies, including data insights, expertise, and technology. For more information and to receive its latest insights, subscribe to CFIG's newsletter.
Do you want to close wealth and opportunity gaps in your community?
Harness the power of data to advance racial equity and economic inclusion. Download our Data Tool Playbook for resources to support local governments.